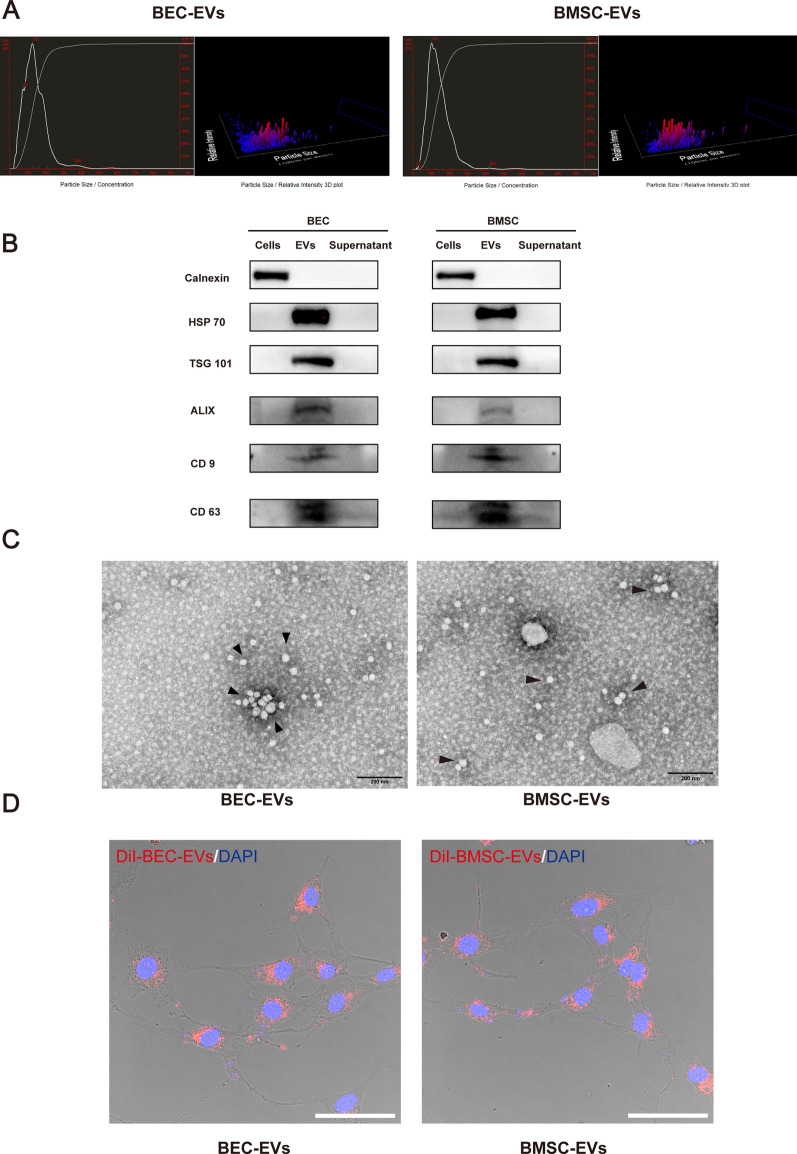
Fig. 1.
Characterization of BEC-EVs and BMSC-EVs. A NTA of BEC-EVs and BMSC-EVs showed the size of EVs. B Representative western blotting of EVs marker HSP 70, TSG 101, ALIX, CD9, and CD63. Cells and supernatant without EVs were regarded as negative control, respectively, and calnexin was defined as endoplasmic reticulum marker which presented exclusively in cells. C Representative TEM images of BEC-EVs and BMSC-EVs (Black arrowheads). Scale Bar: 200 nm. Magnification: 40 k × . All images were taken in the same scale. D Representative confocal microscope images of b. End3 cells phagocytizing DiI labeled BEC-EVs and BMSC-EVs. Scale Bar: 50 μm. Magnification: 63 × . All images were taken in the same scale

