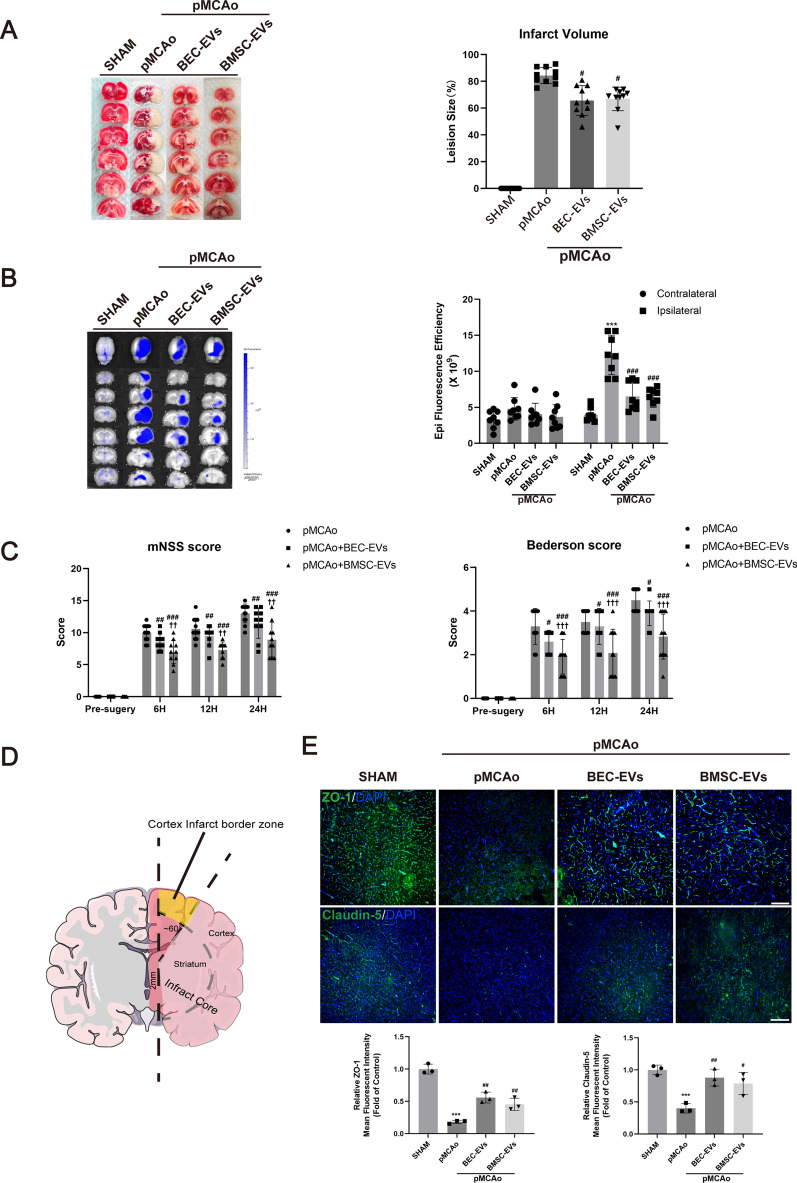
Fig. 5.
BEC-EVs and BMSC-EVs treatments improved neurological injury, BBB leakage and ZO-1 and Claudin-5 expressions after acute IS. A Representative TTC staining images of total brain slices from pMCAo rats and relative infarction volume quantification (n = 8). B Representative images of EB leakage determined by IVIS and quantification of fluorescent efficacy (n = 8). C The evaluation of neurological function by mNSS and Bederson tests (n = 10). D Schematic of cortex infarct border area observed in immunofluorescent staining. E Representative immunofluorescent staining and expression quantification of ZO-1 and Claudin-5 in cortex infarct border area (n = 3). Scale Bar: 200 μm. Magnification: 10 × . All images were taken in the same scale. ***P < 0.001 vs. SHAM group; ###P < 0.001, ##P < 0.01, #P < 0.05 vs. pMCAo group; †††P < 0.001, ††P < 0.01, vs. pMCAo + BEC-EVs

