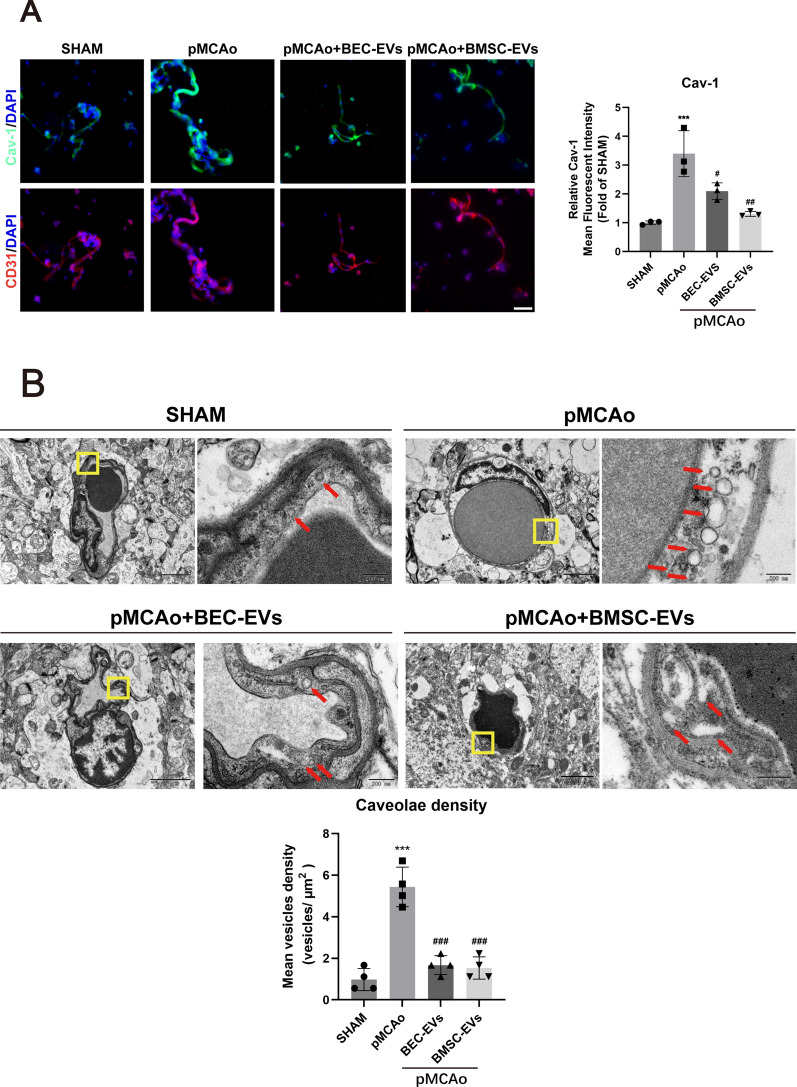
Fig. 6.
Distribution and expression of Caveolin-1 and Caveolae in brain microvessels. A Representative immunofluorescence staining images and quantification of Caveolin-1 and CD 31 in BMV (n = 3). Scale Bar: 50 μm. Magnification: 40 × . All images were taken in the same scale. B TEM image of caveolae-like vesicles in brain microvascular endothelial cells and quantification of the density. Scale Bar: 2 μm and 200 nm. Magnification: 2 k × and 20 k × . All images were taken in the same scale. ***P < 0.001 vs. SHAM group; ###P < 0.001, ##P < 0.05, #P < 0.01 vs. pMCAo group

