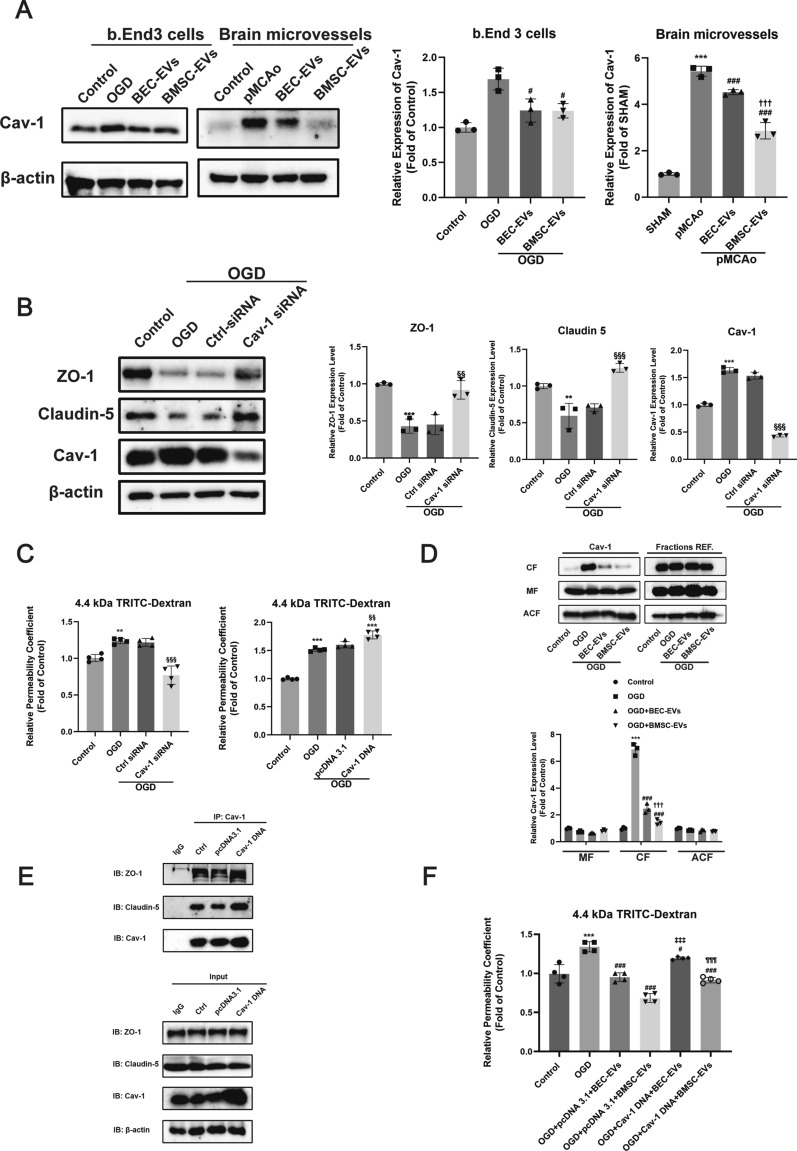
Fig. 7.
BEC-EVs and BMSC-EVs treatments antagonized Cav-1-dependent ZO-1 and Claudin-5 endocytosis to decrease BBB permeability. A Representative western blotting of Cav-1 in OGD insulted b. End3 cells and BMV from ischemic cortex; and quantification of Cav-1 expression (n = 3). B Representative western blotting of ZO-1, Claudin-5 and Cav-1 after Cav-1 siRNA transfection in OGD insulted b. End3 cells and quantification of ZO-1, Claudin-5 and Cav-1 expressions (n = 3). C Relative permeability coefficient of OGD insulted b. End3 cells after siRNA/pcDNA 3.1 transfection (n = 4). D Representative western blotting of Cav-1 in subcellular fractions. MF Membrane fraction; CF Cytoplasm fraction; ACF Actin cytoskeleton fraction; Fractions REF. (Calpain I for AF, Calnexin for MF and Vimentin for ACF, respectively) and quantification of Cav-1 expression in subcellular fractions (n = 3). E Representative co-ip results of Cav-1 with ZO-1 and Claudin-5 after Cav-1 pcDNA 3.1 transfection in b. End3 cells, and IgG was served as negative control. IP: Immunoprecipitation; IB: Immunoblotting. F Relative permeability coefficient of OGD insulted b. End3 cells with pcDNA 3.1 transfection after the treatments of EVs from two sources (n = 4). ***P < 0.001, **P < 0.01 vs. Control/SHAM group; ###P < 0.001, #P < 0.05 vs. pMCAo/OGD group; †††P < 0.0001, vs. pMCAo + BEC-EVs. §§§P < 0.001, §§P < 0.01 vs. Ctrl-siRNA/pcDNA 3.1 group. ‡‡‡P < 0.001 vs. OGD + pcDNA 3.1 + BEC-EVs group; ¶¶¶P < 0.001 vs. OGD + pcDNA 3.1 + BMSC-EVs group

