
FIGURE 2.
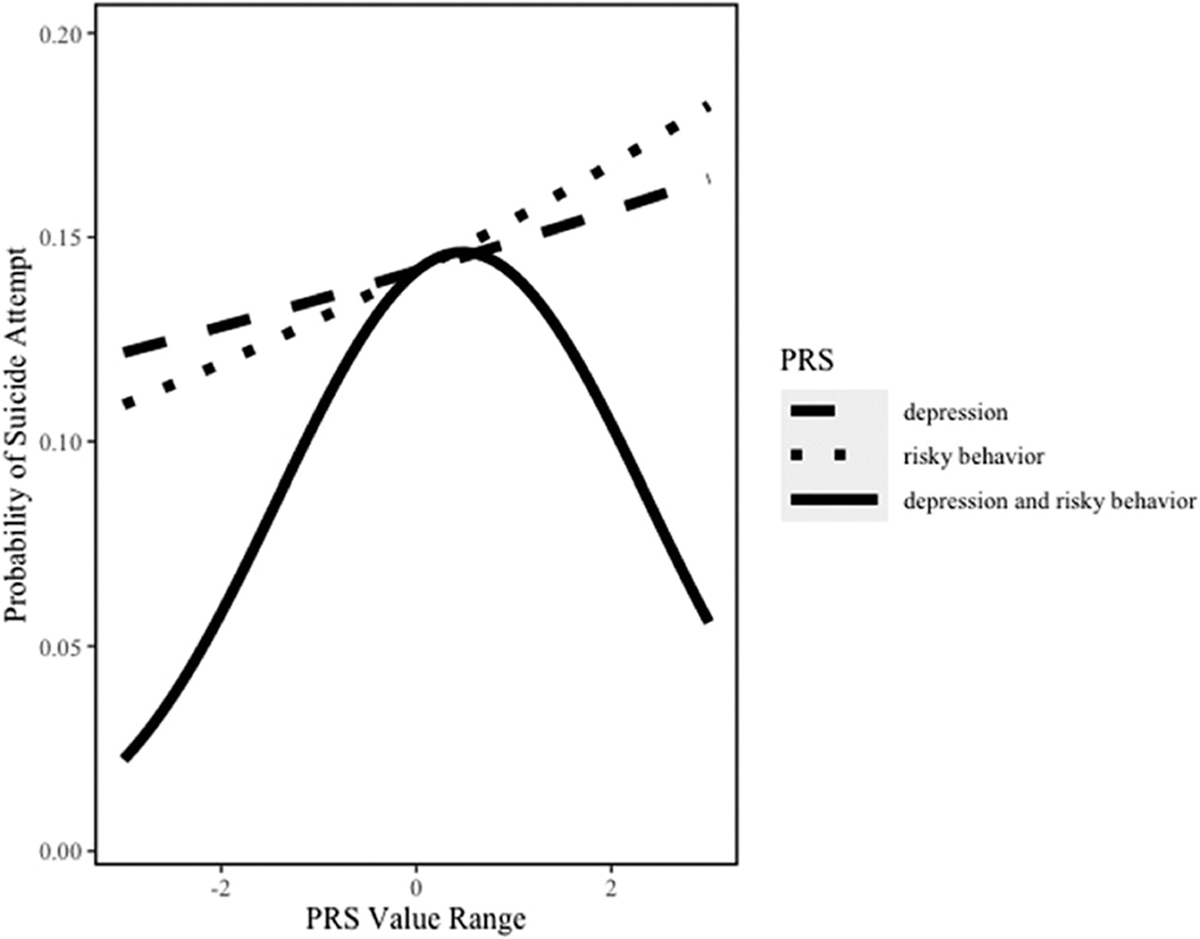
Relation between risky behavior PRS and depression PRS in relation to suicide attempt among the whole sample. *All lines plot the model estimated probability of suicide attempt while varying the indicated PRS—either depression only, risky behavior only, or both simultaneously—and holding all other covariates constant at their sample means