
FIGURE 3.
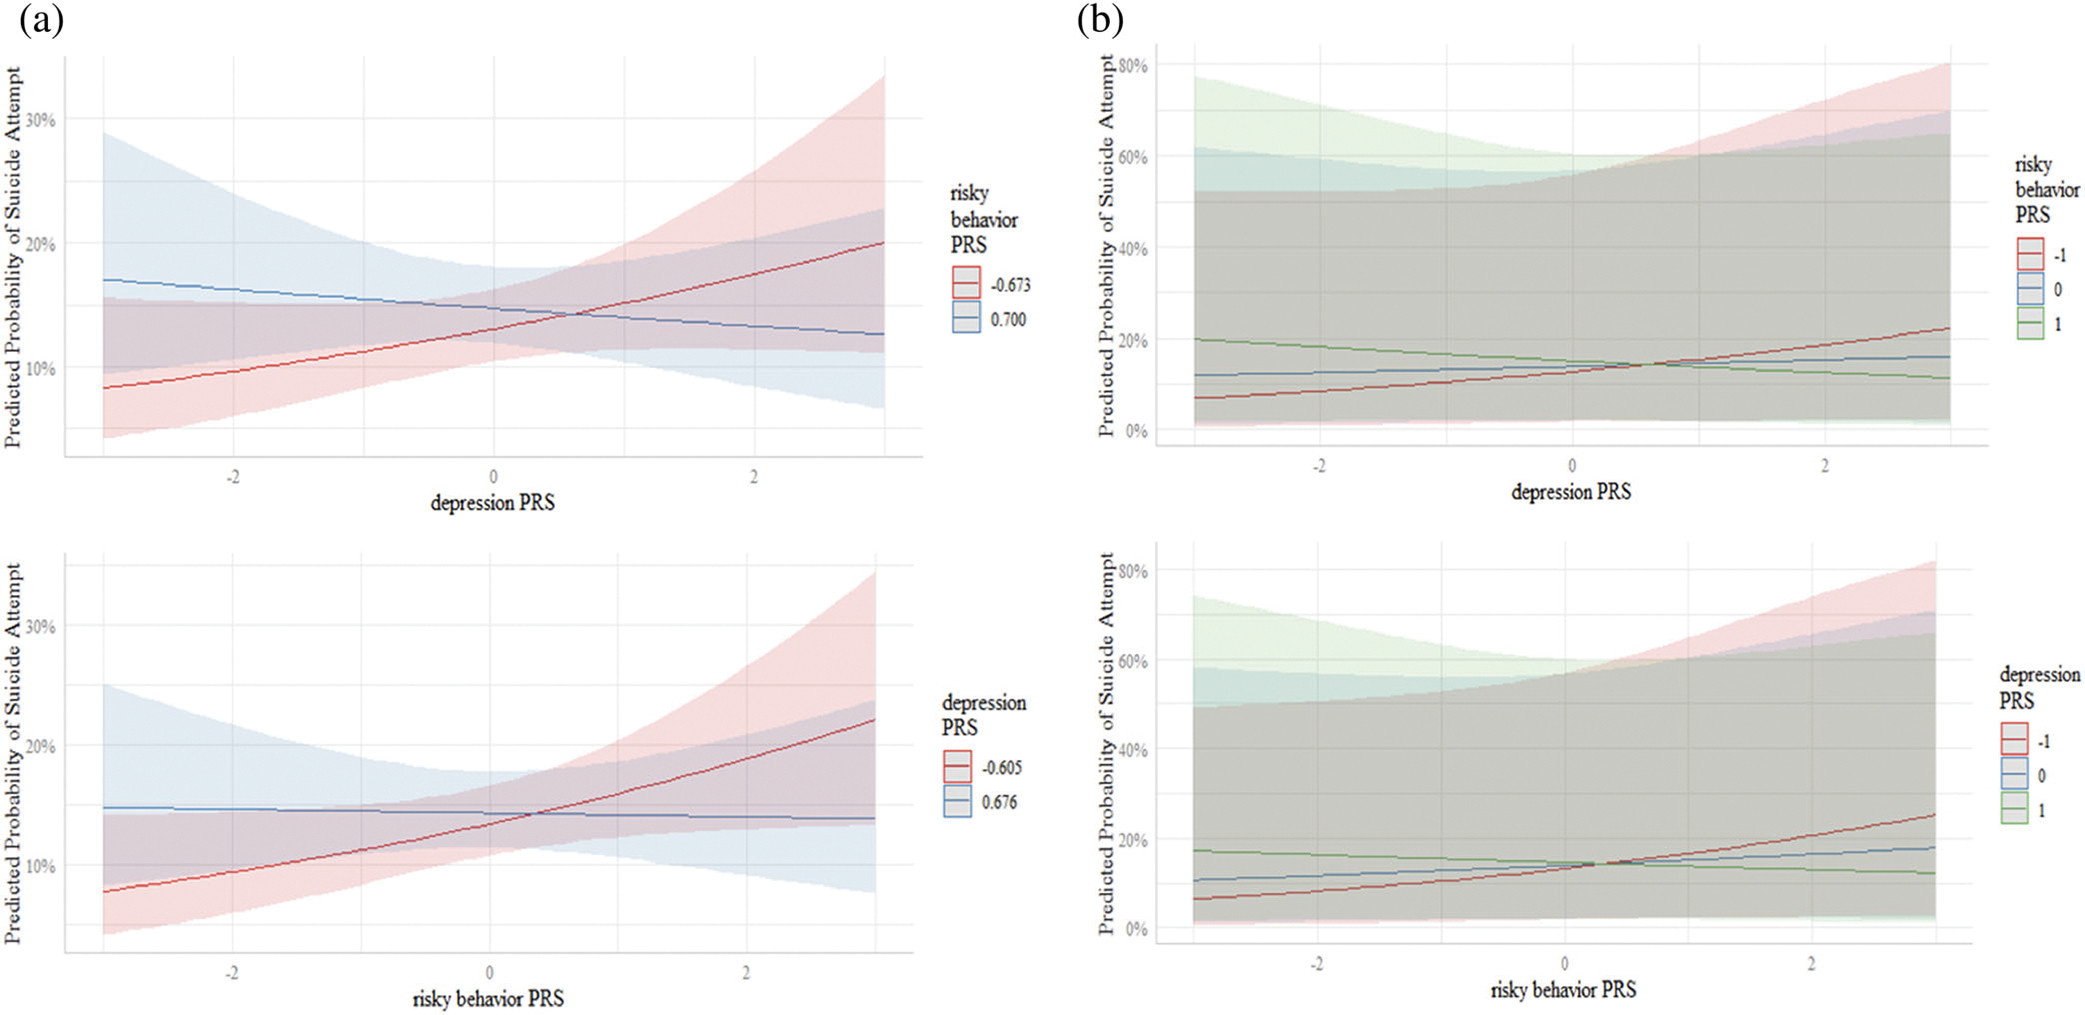
(a) Predicted probability of suicide attempt (with 95% confidence intervals) as a function of depression PRS with risky behavior PRS fixed at the 25th and 75th quartiles, and vice versa. (b) Predicted probability of suicide attempt (with 95% prediction intervals) as a function of depression PRS with risky behavior PRS fixed at 1 SD below the mean, the sample mean, and 1 SD above the mean, and vice versa