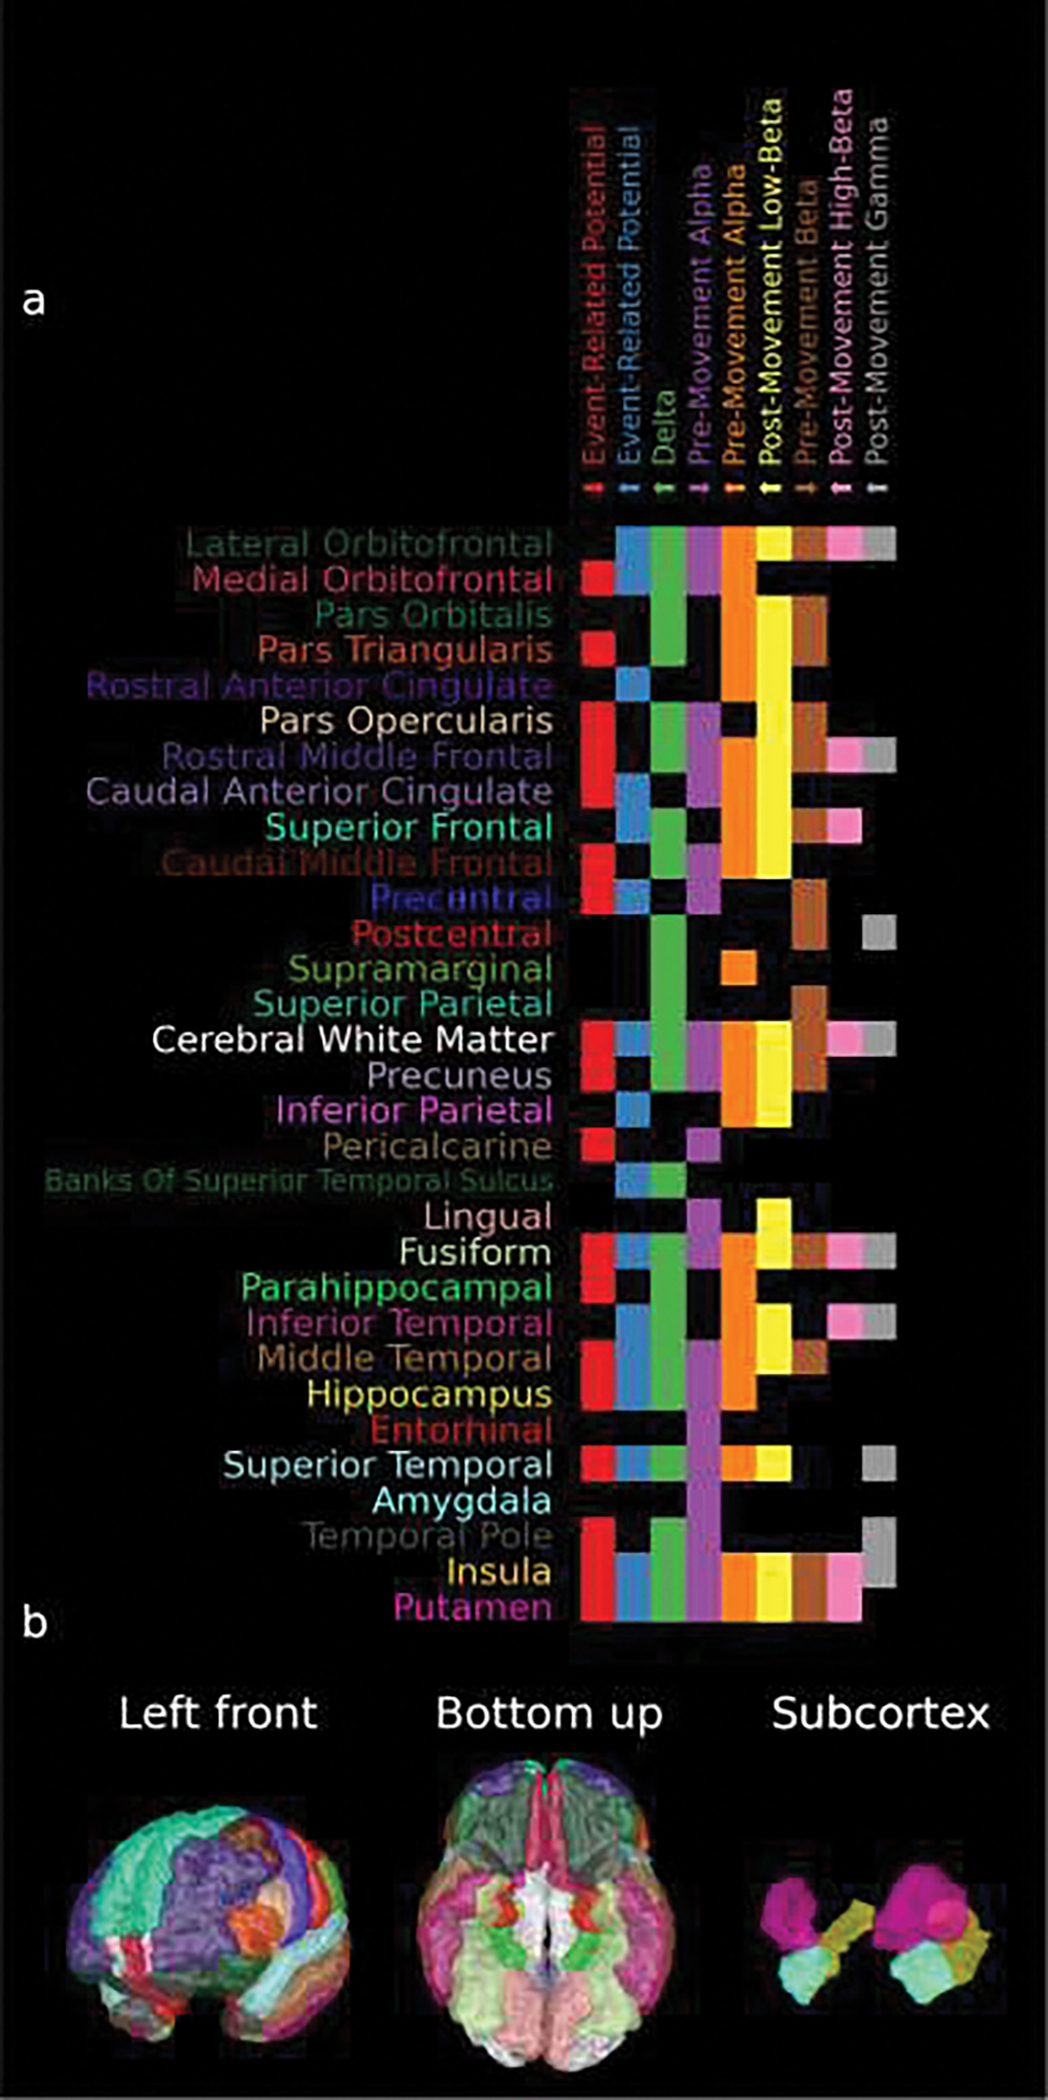
Figure 10.

a) The Deskian-Killiany atlas labels, based on the individual patient’s brain anatomy, with significant-accuracy SVM classifications that used that oscillatory pattern as determined in Figure 9. Note that up arrows preceding the feature name indicate that that feature increased during movement period and down arrows indicate the opposite. b) The locations of the labels used in (a) on the template atlas with the colors matching the colors of the names of the brain regions of interest on the y-axis of (a). Note that the atlas labels are sorted clockwise by their angle in the sagittal plane, starting with frontal areas and wrapping around to temporal areas.
