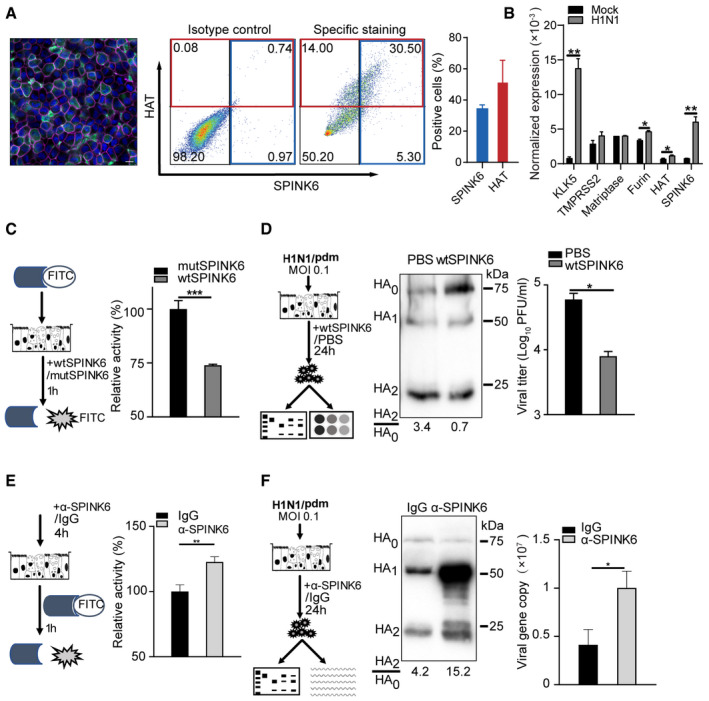
Figure 4. Exogenous and endogenous SPINK6 affect virus maturation and viral replication in human airway organoids.

- Confocal imaging (left) shows intrinsic SPINK6 (green) expression in the epithelial cells in 2D human airway organoids. Nuclei and actin filaments are counterstained and shown as blue and purple, respectively. Scale bar, 10 µm. Flow cytometry analysis demonstrates HAT and SPINK6 expression in human airway organoids. The plots (middle) show the representative result of one experiment performed three times. The percentages of HAT and SPINK6 positive cells (right) are shown as mean and SD of three independent experiments.
- At 24 h after inoculation of H1N1/pdm or mock inoculation in triplicate, 2D human airway organoids were harvested to detect mRNA expression levels of the indicated genes normalized with GAPDH. Data represent the mean and SD of a representative experiment performed three times.
- 2D human airway organoids were incubated with the fluorogenic substrate in triplicate for 1 h in the presence of wtSPINK6 or mutSPINK6, and applied to fluorescence assay. The fluorescence intensity of mutSPINK6‐treated organoids is arbitrarily set as 1. Data represent the mean and SD of a representative experiment performed three times.
- After inoculation of H1N1/pdm, 2D human airway organoids were incubated with wtSPINK6 or PBS in triplicate for 24 h (left). Cell‐free culture media were harvested for viral titration (right) and examination of HA cleavage by WB after 10‐fold concentration (middle). Viral titer data present the mean and SD of triplicated samples.
- 2D airway organoids were applied to fluorescence assay after incubation with α‐SPINK6 or isotypic IgG in triplicate for 4 h (left). Data present the mean and SD of triplicated samples.
- After inoculation of H1N1/pdm, 2D human airway organoids were incubated with an α‐SPINK6 or isotype IgG in triplicate for 24 h (left). Cell‐free culture media were harvested for viral load detection (right) and examination of HA cleavage by WB after 10‐fold concentration (middle). Viral load data present the mean and SD of triplicated samples.
Data information: *P < 0.05; **P < 0.01; ***P < 0.001. Student’s t test.
Source data are available online for this figure.
