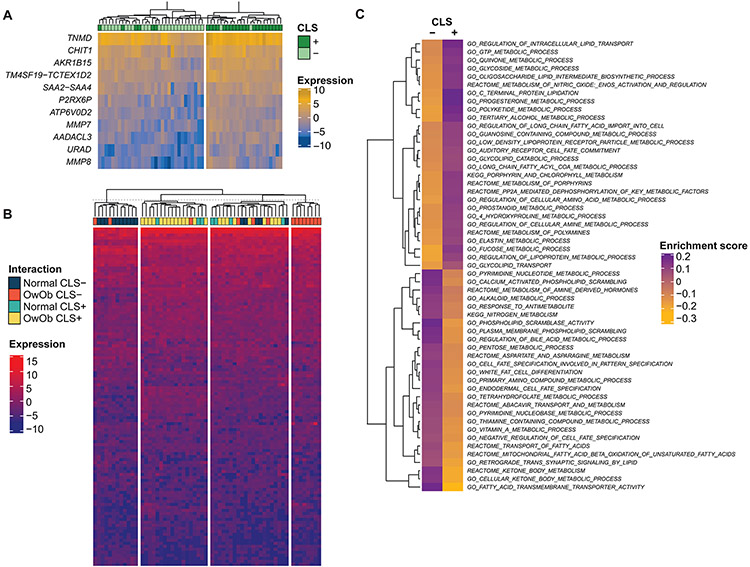
Figure 4: Transcriptomic profiles and metabolic pathway gene sets associations with white adipose tissue inflammation as determined by the presence of crown-like structures (CLSs).
(A) Heatmap illustrating 11 genes differentially expressed as they relate to CLS status. Illustrated genes were selected based on an absolute log 2-fold change >1.5 and a false discovery rate (FDR) <0.1. (B) Heatmap illustrating an unsupervised clustering analysis of differentially expressed genes based on CLS status and body mass index (BMI) categorization (normal, <25 kg/m2; overweight/obese, >25 kg/m2). (C) Gene set enrichment analysis using MSigDB, fetching pathways related to metabolism. The median value of the enrichment score was estimated for each pathway between the CLS-positive and CLS-negative cohorts. The figure illustrates pathways that were considered enriched when the absolute difference between the average value of the two groups was greater than the 95th quantile.

