
FIGURE 2.
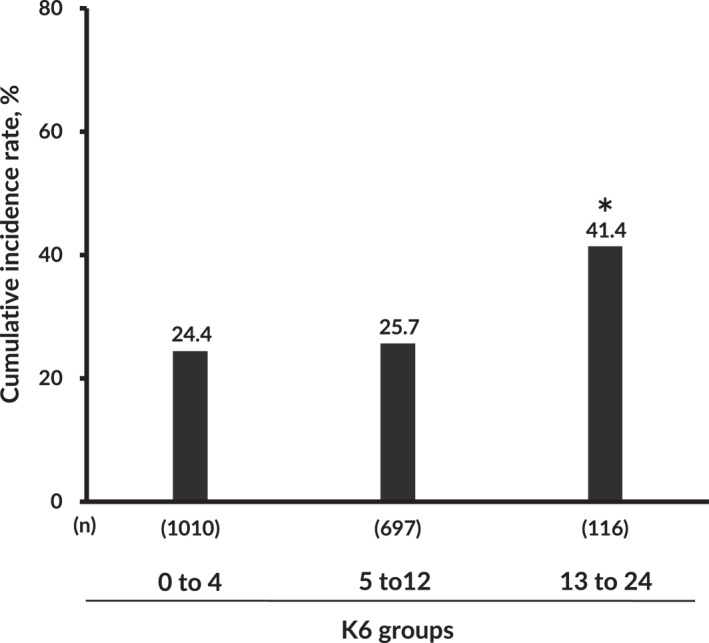
The cumulative incidence rate of poor academic performance (GPA <2.0) during the 4 years of university study. *p < 0.0001 versus 0–4‐point group, p for trend <0.01
Official websites use .gov
A
.gov website belongs to an official
government organization in the United States.
Secure .gov websites use HTTPS
A lock (
) or https:// means you've safely
connected to the .gov website. Share sensitive
information only on official, secure websites.
The cumulative incidence rate of poor academic performance (GPA <2.0) during the 4 years of university study. *p < 0.0001 versus 0–4‐point group, p for trend <0.01