
FIGURE 1.
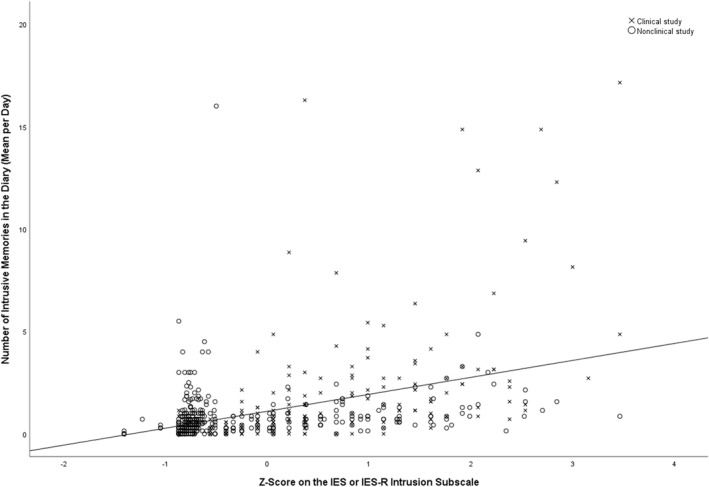
Scatterplot presenting the association between the number of intrusive memories in the diary (mean per day) and standardized scores on the IES/IES‐R Intrusion subscale
Official websites use .gov
A
.gov website belongs to an official
government organization in the United States.
Secure .gov websites use HTTPS
A lock (
) or https:// means you've safely
connected to the .gov website. Share sensitive
information only on official, secure websites.
Scatterplot presenting the association between the number of intrusive memories in the diary (mean per day) and standardized scores on the IES/IES‐R Intrusion subscale