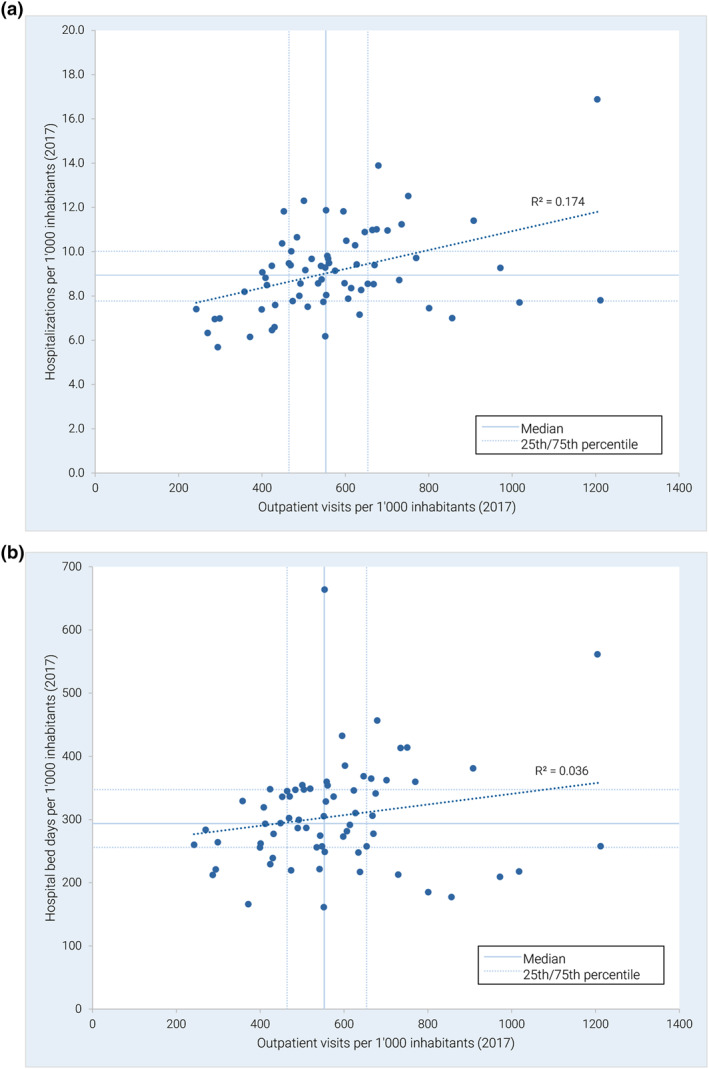
FIGURE 3.

(a) Rate of hospitalizations and rate of outpatient visits per 1000 inhabitants and year in the 68 health service areas for psychiatric outpatient care (HSA‐PSY). (b) Rate of hospital bed days and rate of outpatient visits per 1000 inhabitants and year in the 68 health service areas for psychiatric outpatient care (HSA‐PSY)
