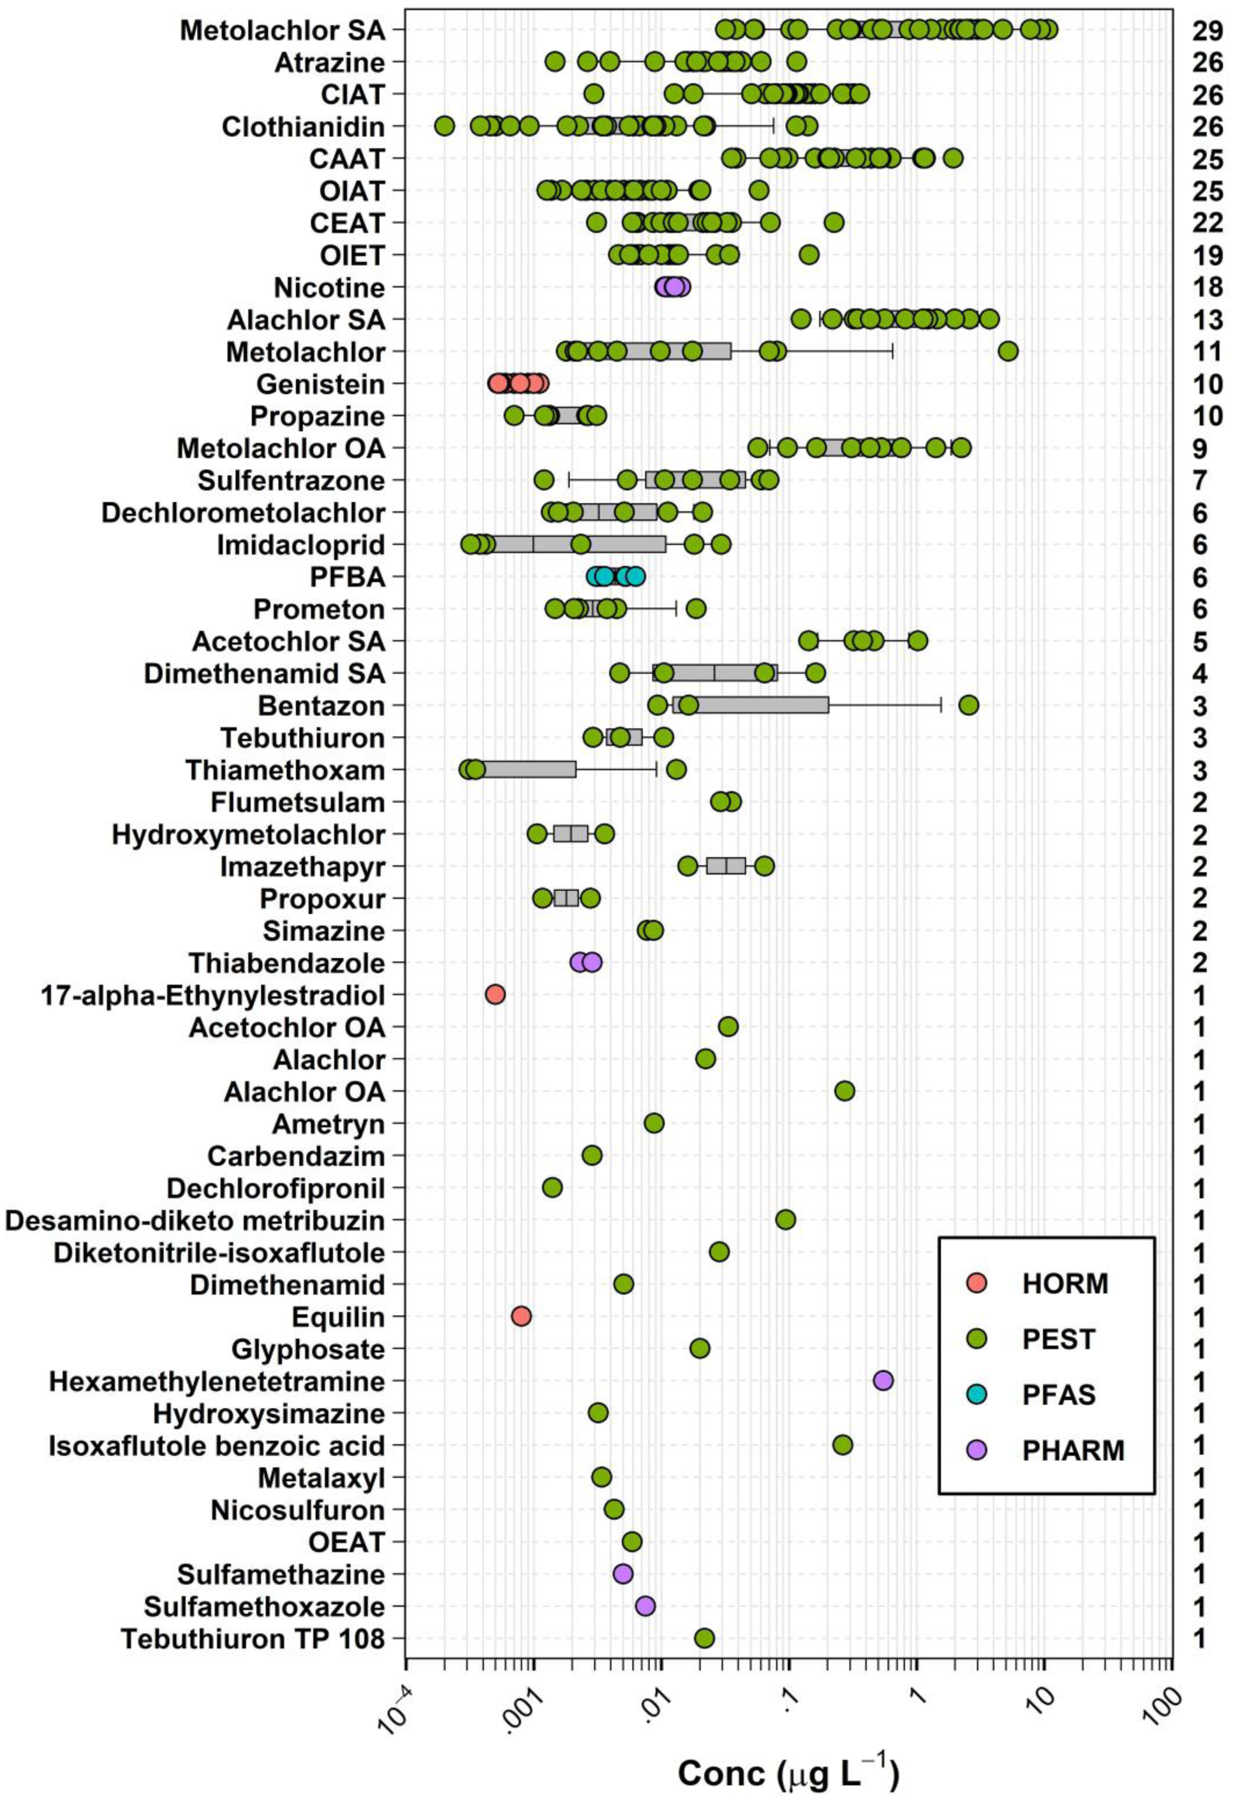
Figure 2.

Detected concentrations (circles, μg L−1) and number of sites (right axis) for 52 organic analytes (left axis, in order of decreasing total detections) detected in samples of private-supply tapwater collected during 2018–19 in northeast Iowa. Circles (●) are data for individual samples. Boxes, centerlines, and whiskers indicate interquartile range, median, and 5th and 95th percentiles, respectively. Symbol colors identify hormone (HORM), pesticide (PEST), per/polyfluoroalkyl substances (PFAS), and pharmaceutical (PHARM) classes.
