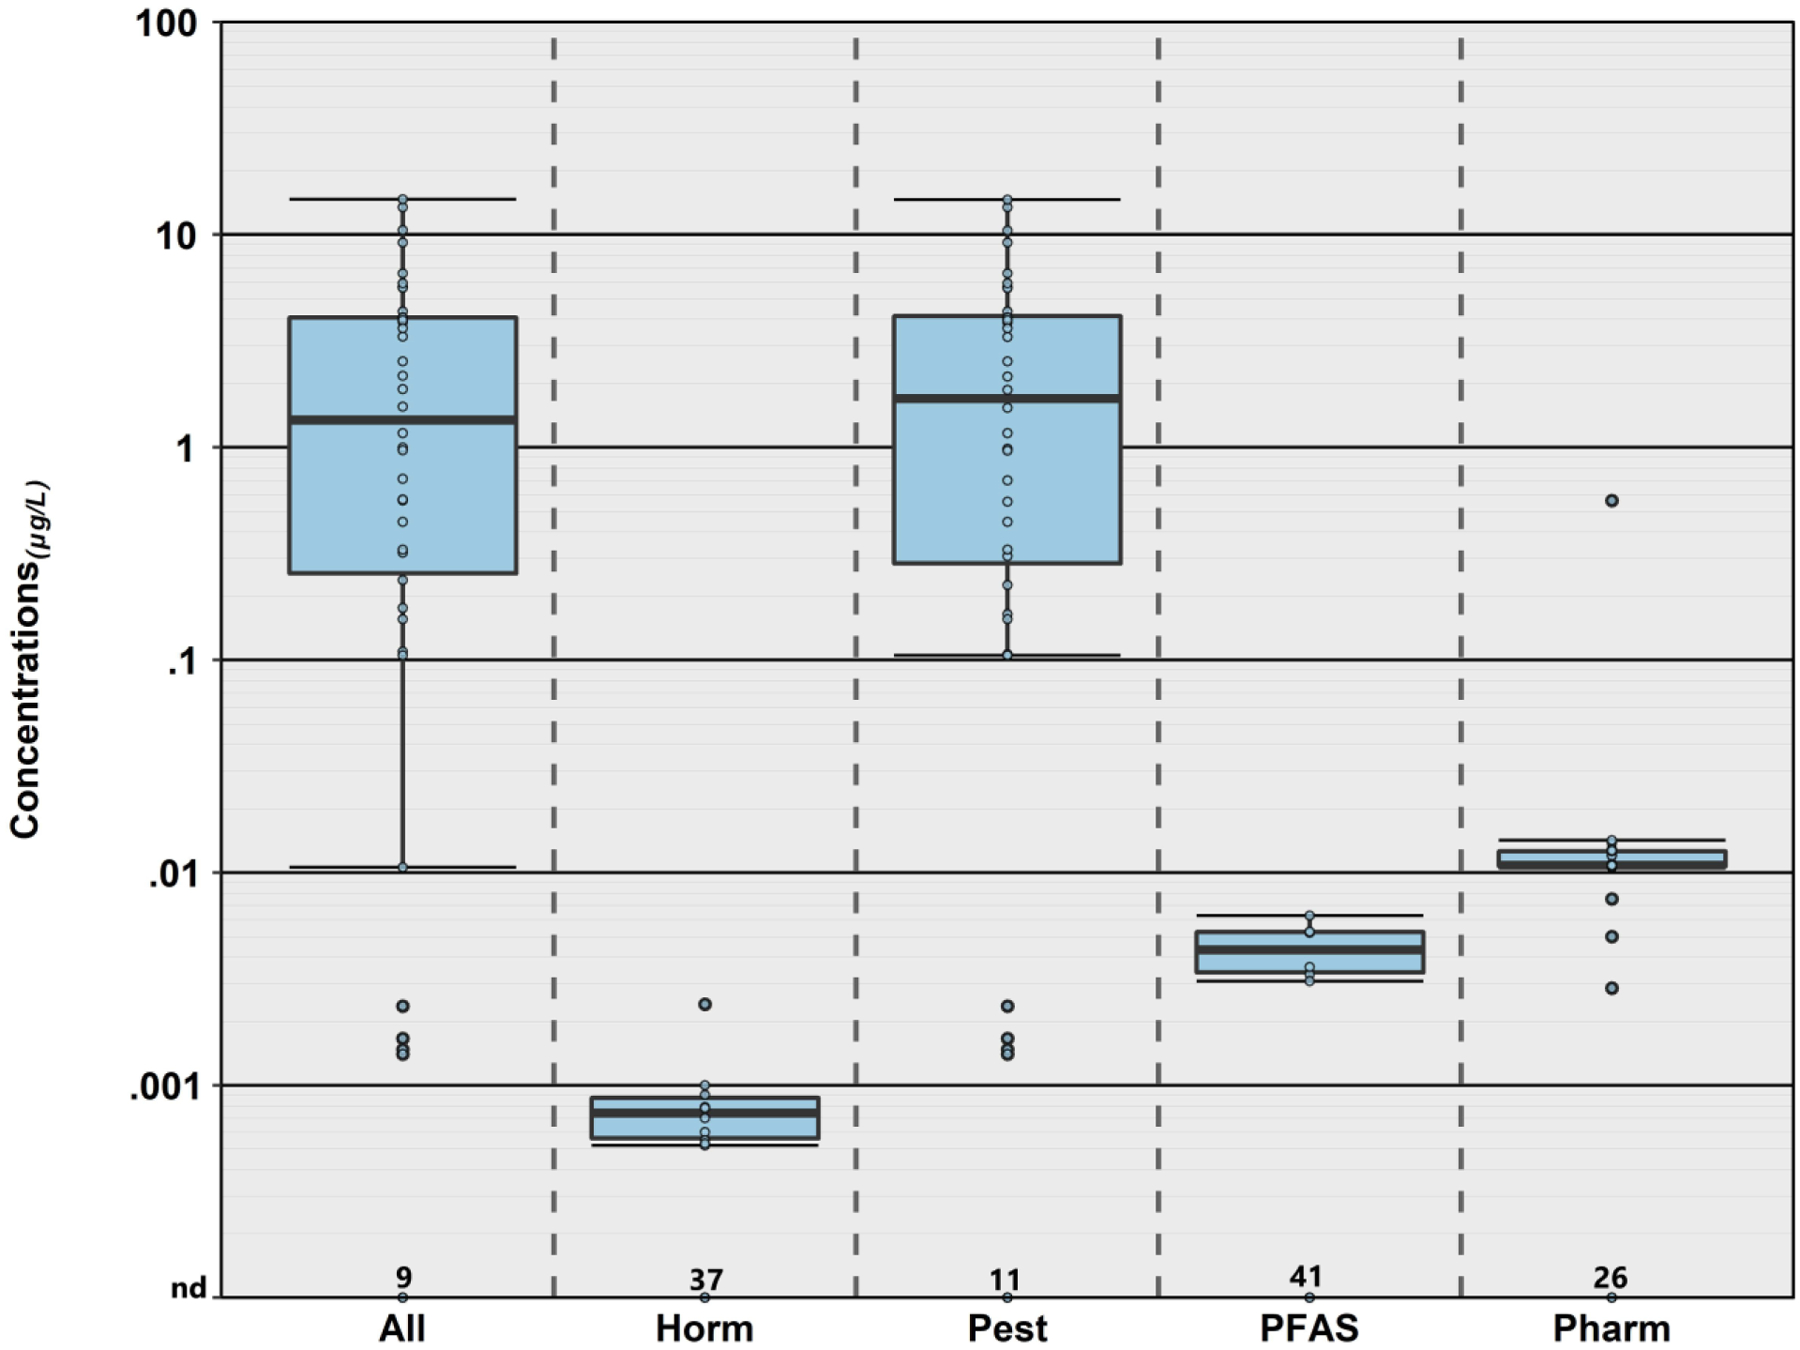
Figure 4.

Cumulative concentration (μg L−1) of all organic analytes and classes of organic analytes detected in samples of private-supply tapwater collected during 2018–19 in northeast Iowa. Boxes, centerlines, and whiskers indicate interquartile range, median, and 5th and 95th percentiles, respectively. “nd” indicates not detected. HORM, PEST, PFAS, and PHARM indicate hormone, pesticide, per/polyfluoroalkyl substances, and pharmaceutical classes, respectively.
