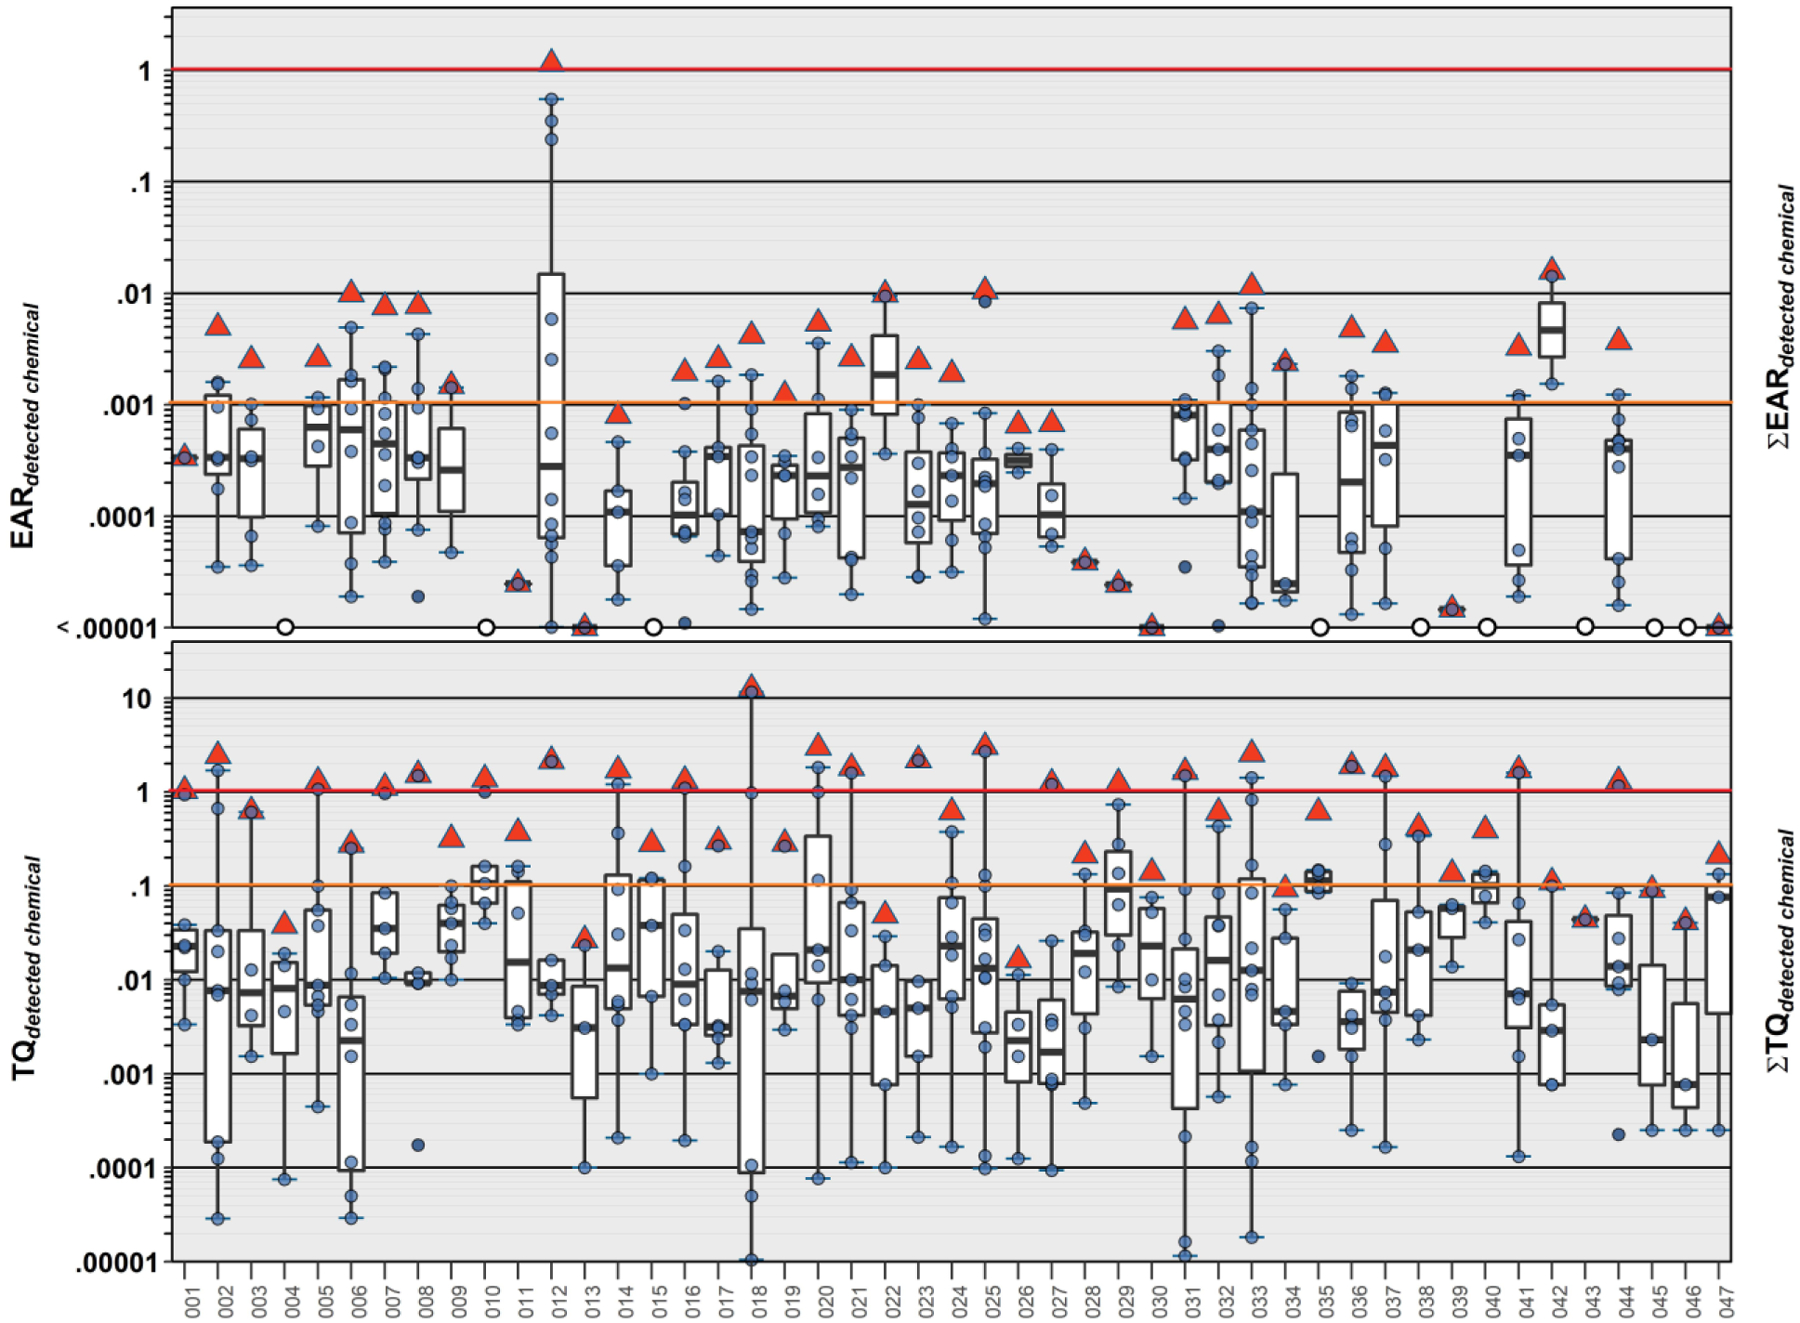
Figure 5.

Top. Individual EAR values (circles, ●) and cumulative EAR (∑EAR, sum of all detected; red triangles, ▲) across all assays for 43 organic analytes detected in samples of private-supply tapwater collected during 2018–19 in northeast Iowa. Red and orange lines indicate concentrations shown to modulate effects in vitro (EAR = 1) and effects-screening-level thresholds (EAR = 0.001), respectively. Bottom. Human health benchmark-based individual TQ values (circles) and cumulative TQ (∑TQ, sum of all detected; red triangles, ▲) for inorganic and organic analytes listed in Table S11 and detected in samples of private-supply tapwater. Red and orange lines indicate benchmark equivalent concentrations (TQ = 1) and effects-screening-level threshold of concern (TQ = 0.1), respectively. Boxes, centerlines, and whiskers indicate interquartile range, median, and 5th and 95th percentiles, respectively, for both plots.
