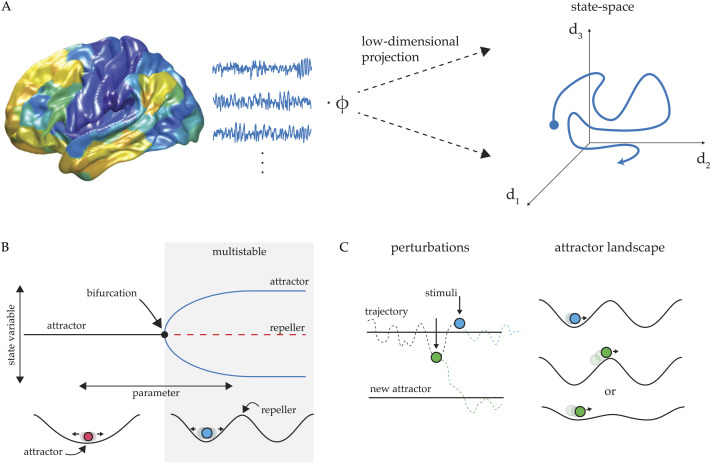
Figure 1. .
Overview of state space concept. (A) Large multivariate recordings of brain activity, such as in neuroimaging datasets, can be more tractable to analyze and visualize after first projecting the data into a state space sensitive to a desired feature in the data—for example, principal components for variance, or independent components for distinct signals. (B) Upper panel: pitch-fork bifurcation diagram showing a parameter change that transitions the system from a single stable attractor regime to a multistable regime with two stable attractors (blue lines) and one unstable attractor (red, dotted line). Lower panel: a potential energy landscape depiction of the same unistable and multistable regimes from above. (C) Identifying the attractor landscape of a system provides a reference for the system’s dynamics, which then predicts distinct response to perturbation. External input to a system can be treated either as a perturbation to the system’s trajectory or as a deformation of the system’s attractor landscape.

