
Table 1.
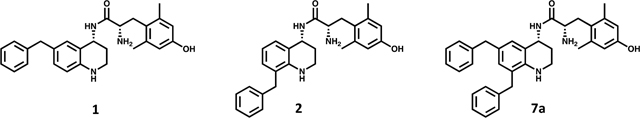
Effects of Benzyl Pendant Position on Binding Affinity, Potency, and Efficacya
| ||||||||||
|---|---|---|---|---|---|---|---|---|---|---|
| binding affinity Ki (nM) | potency EC50 (nM) | efficacy (% stimulation) | ||||||||
|
|
|
|
||||||||
| compd | MOR | DOR | KOR | DOR Ki/MOR Ki | MOR | DOR | KOR | MOR | DOR | KOR |
| 1 | 0.22 (0.02) | 9.4 (0.8) | 68 (2) | 43 | 1.6 (0.3) | 110 (6) | 540 (70) | 81 (2) | 16 (2) | 22 (2) |
| 2 | 48 (9) | 360 (60) | 1500 (400) | 7.5 | 1200 (300) | dns | dns | 37 (4) | dns | dns |
| 7a | 1.0 (0.1) | 1.6 (0.4) | 23 (5) | 1.6 | 4 (2) | 380 (84) | dns | 96 (4) | 42 (7) | dns |
a
Binding affinities (Ki) were obtained by competitive displacement of radiolabeled [3H]-diprenorphine in membrane preparations. Functional data were obtained using agonist induced stimulation of [35S]-GTPγS binding assay. Potency is represented as EC50 (nM), and efficacy as percent maximal stimulation relative to standard agonist DAMGO (MOR), DPDPE (DOR), or U69,593 (KOR) at 10 μM. All values are expressed as the mean of three separate assays performed in duplicate with standard error of the mean (SEM) in parentheses. dns = does not stimulate (<10%).