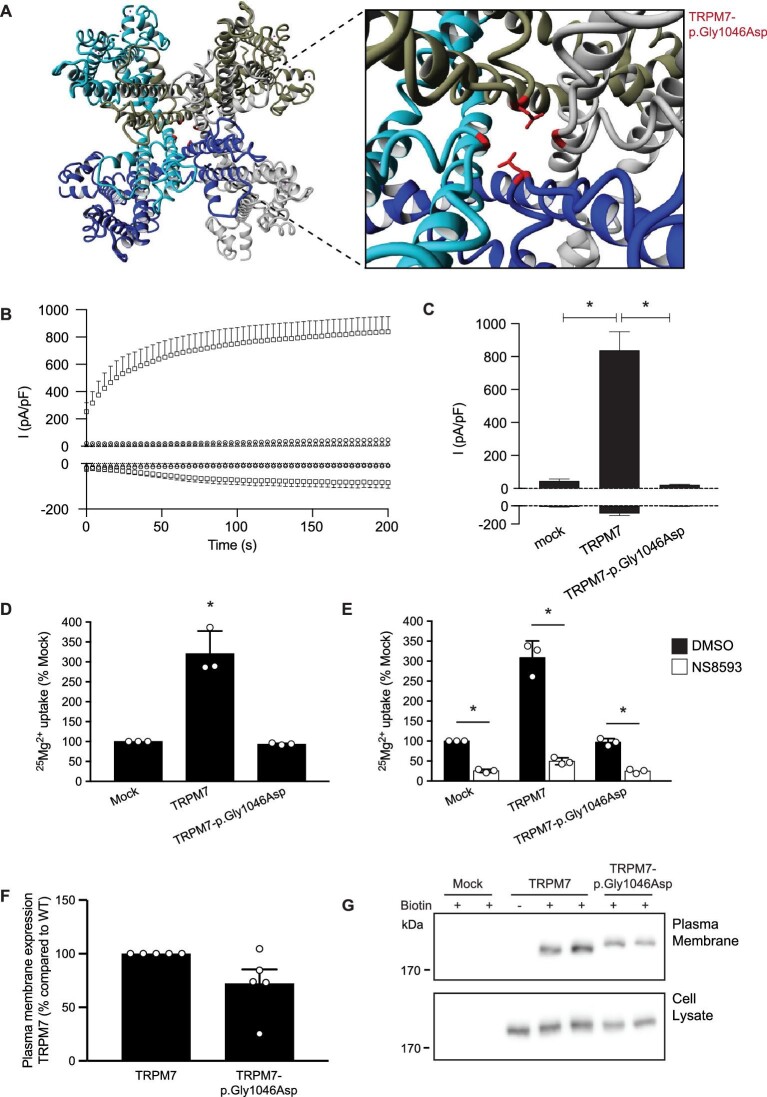
FIGURE 4:
The TRPM7-p.Gly1046Asp mutant of family 2 results in decreased Mg2+ uptake. (A) Molecular modelling using the structure of human TRPM7 (pdb: 5ZX5). The outtake shows the heterozygous p.Gly1046Asp mutation present in two out of the four subunits of the channel. (B) Averaged time course of outward (+80 mV) and inward (–80 mV) from HEK293 cells transfected with TRPM7 wild-type (squares, n = 9) or TRPM7-p.Gly1046Asp (triangles, n = 9) and non-transfected HEK293 cells as control (circles, n = 6). (C) Bar graph presenting the current densities at +80 mV and –80 mV of indicated conditions at 200 s after establishing whole-cell configuration. Mean + standard error of the mean (SEM) is shown. An asterisk indicates significance compared with TRPM7 wild-type. (D and E) 25Mg2+ uptake assay of HEK293 cells expressing mock, wild-type TRPM7 and mutant TRPM7-p.Gly1046Asp. Cells were incubated for 15 min in a buffer containing 1 mM 25Mg2+ (98% purity) in the presence or absence of 0.4 (v/v)% DMSO (E, black bars) or 30 µM NS8593 (E, white bars). Intracellular 25Mg2+ content was measured by inductive-coupled plasma mass spectrometry. Graphs show the mean of three independent experiments, which each contained three replicates ± standard deviation; *P < .05 compared with mock (D) or DMSO (E). (F and G) Immunoblots showing similar membrane expression between TRPM7 proteins (upper blot) and a TRPM7 expression control (lower blot). The quantifications show the mean ± SEM of five independent experiments.

