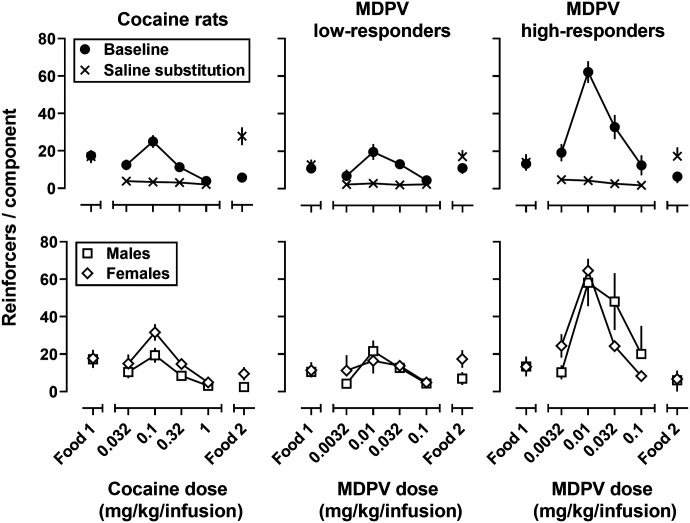
Fig. 1.
Self-administration dose-response curves obtained under a multicomponent FR5 schedule of reinforcement for cocaine (left), MDPV, separated by low- (center) and high-responder phenotype. Top row: number of infusions earned under baseline (drug) conditions (filled circles) and when saline was substituted for cocaine or MDPV during a single session (x). Bottom row: baseline conditions split by male (squares) and female rats (diamonds). Ordinate: reinforcers obtained during each component. Abscissa: Food 1 and Food 2 refer to components when grain-based pellets were available. The numbers refer to dose of cocaine (left) and MDPV (center and right) expressed as mg/kg/infusion on a log scale. Error bars represent ± S.E.M.

