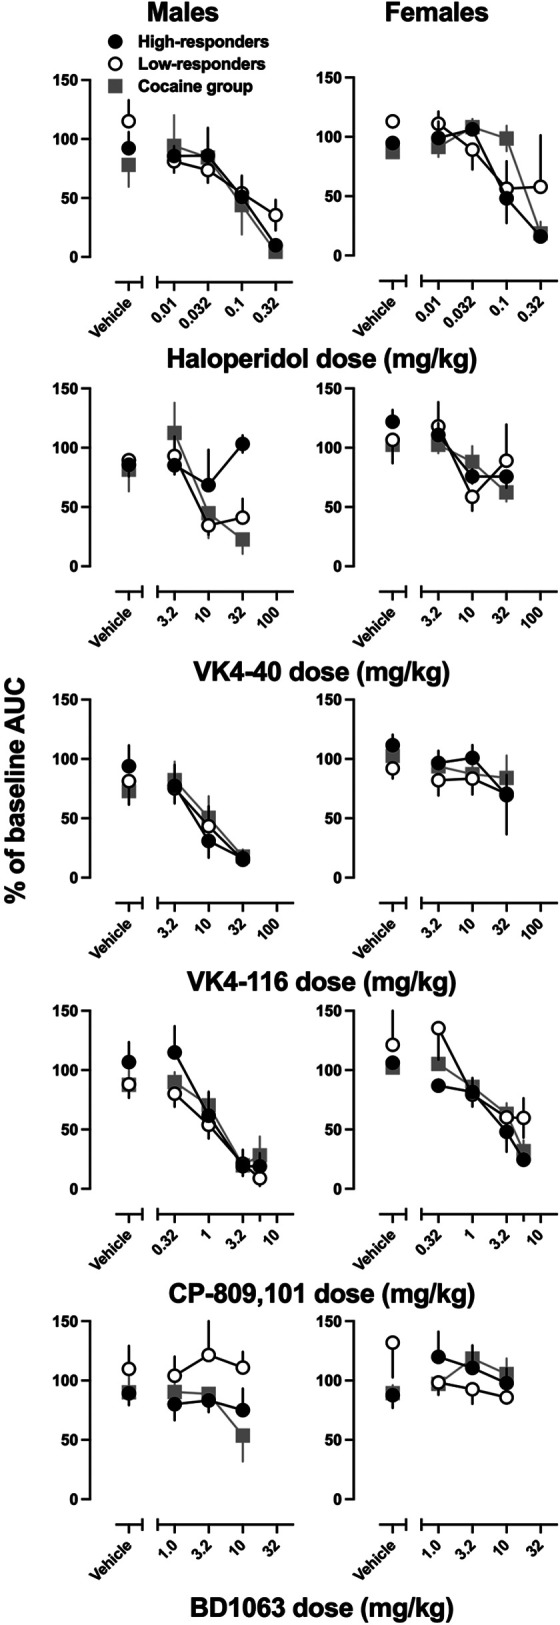
Fig. 3.

Percent of baseline area under the curve (AUC) for haloperidol (top row), VK4-40 (second row), VK4-116 (third row), CP-809,101 (fourth row), and BD1063 (bottom row) in male (left column) and female rats (right column). Ordinate: % of baseline AUC, where baseline in the three sessions prior to pretreatment administration. Abscissa: Vehicle refers to the vehicle for each pretreatment. The numbers refer to the dose of the pretreatment, expressed as mg/kg on a log scale. Error bars represent ± S.E.M.
