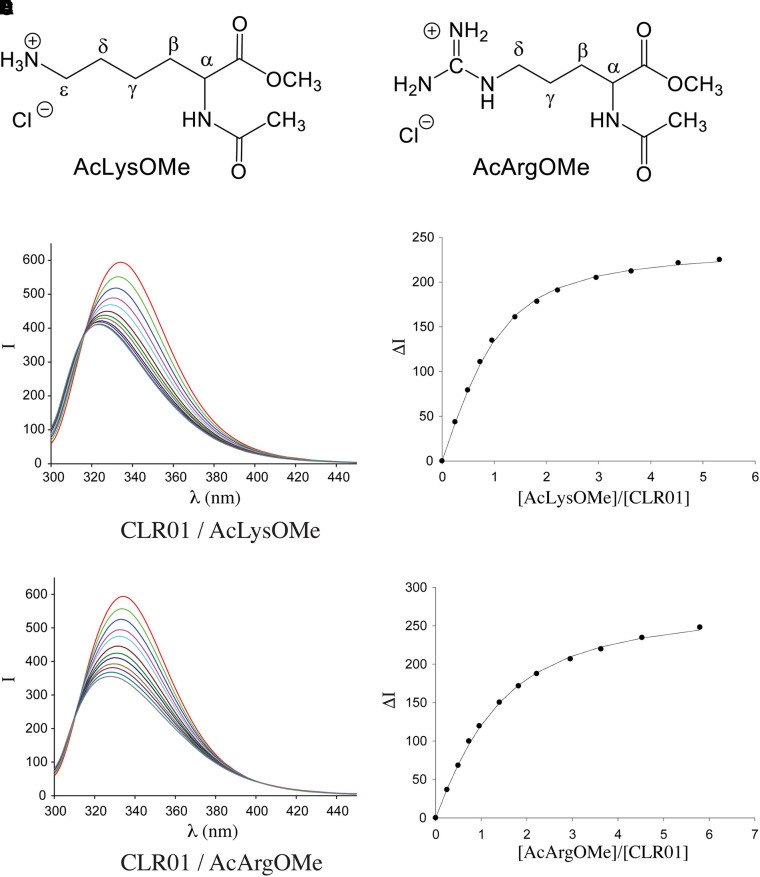
Fig. 4.
Fluorescence titration of CLR01 with Lys or Arg derivatives. All the reactions were carried out in 10 mM phosphate buffer, pH 7.6, and were monitored using λex = 285 nm, λem = 336 nm. (A) Schematic structure of Ac-Lys-OMe. (B) Schematic structure of Ac-Arg-OMe. (C) Fluorescence spectra of CLR01 in the absence or presence of increasing concentrations of Ac-Lys-OMe. (D) Change in fluorescence intensity as a function of increasing Ac-Lys-OMe concentration. (E) Fluorescence spectra of CLR01 in the absence or presence of increasing concentrations of Ac-Arg-OMe. (F) Change in fluorescence intensity as a function of increasing Ac-Arg-OMe concentration.

