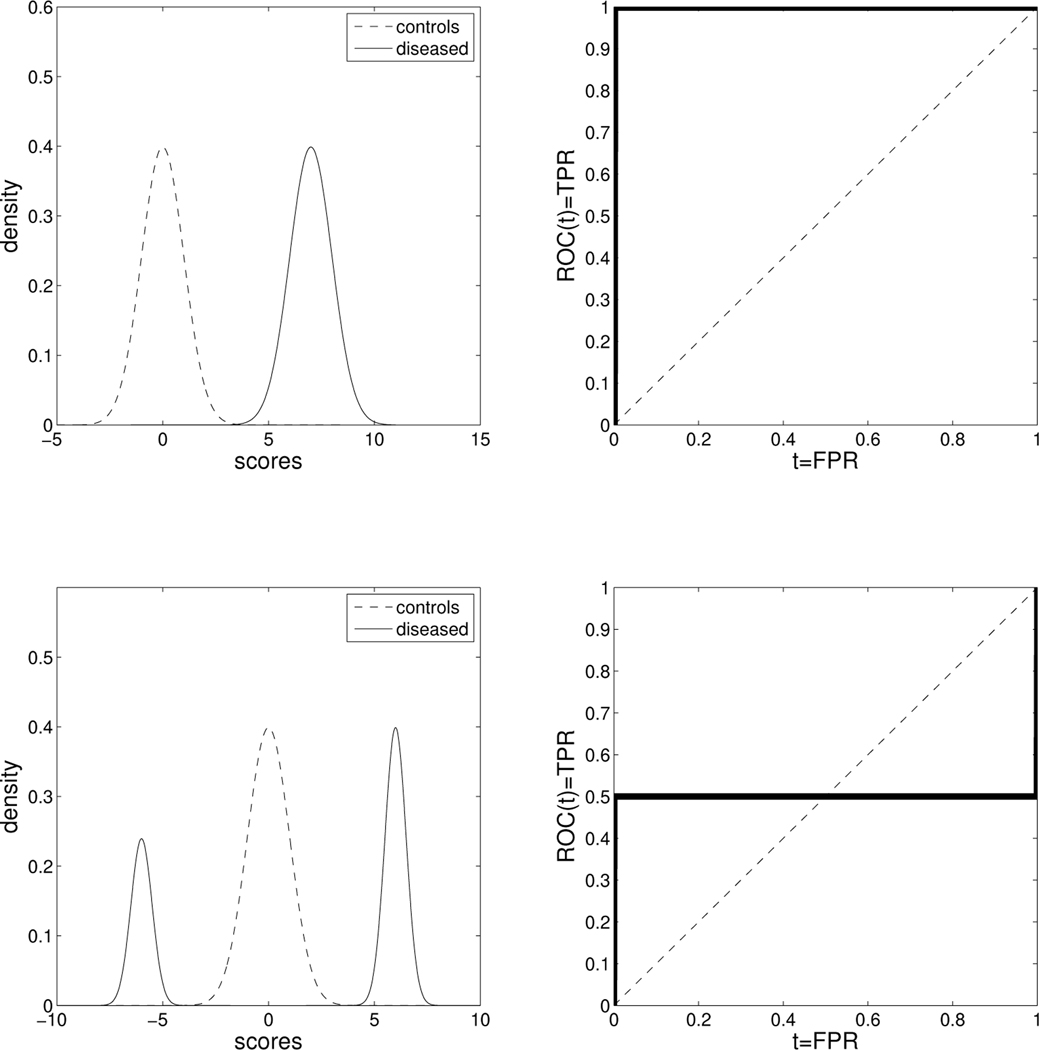
Figure 1.
Upper panels: An example of a perfect biomarker where the densities of the controls and the diseased (left) comply with a traditional framework, under which the stochastic ordering X < Y holds, and the corresponding ROC curve is in the right panel. Corresponding metrics: AUC = 1, pAUC(t1, t2; t2 > t1) = t2 − t1, area between the ROC and the reference diagonal= 0.5, proposed length= 2. Lower panels: An example of a perfect biomarker in which the stochastic ordering X < Y cannot be assumed. Corresponding metrics: AUC = 0.5, pAUC(t1, t2;t2 > t1) = 0.5(t2 − t1), area between the ROC and the reference diagonal= 0.25, proposed length = 2 (the proposed length is immune to directionality and characterizes the underlying biomarker as perfect in both cases, as opposed to all other measures.)

