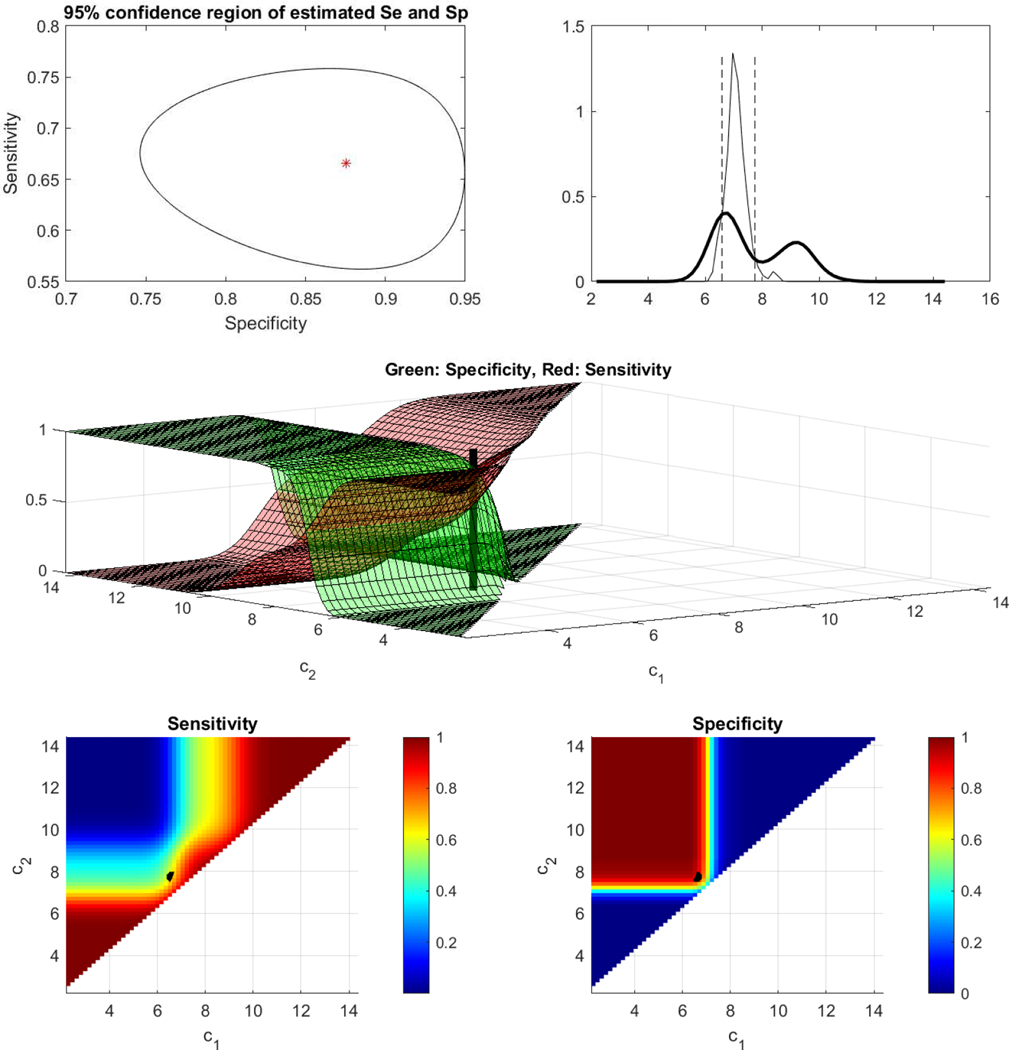
Figure 11.
ESCC data (probe 209644). Top left: Egg shaped 95% confidence region for the sensitivity and specificity at the Youden-based estimated cutoffs. Top right: Underlying kernel densities of the healthy and the diseased. Middle: Surfaces of sensitivity and specificity along with the estimated Youden-based optimal pair of cutoffs. Bottom left: Contour plot of the surface of sensitivity for all possible cutoffs, along with the estimated Youden-based optimal pair of cutoffs (black dot). Bottom right: Contour plot of the surface of specificity for all possible cutoffs, along with the estimated Youden-based optimal pair of cutoffs (black dot).

