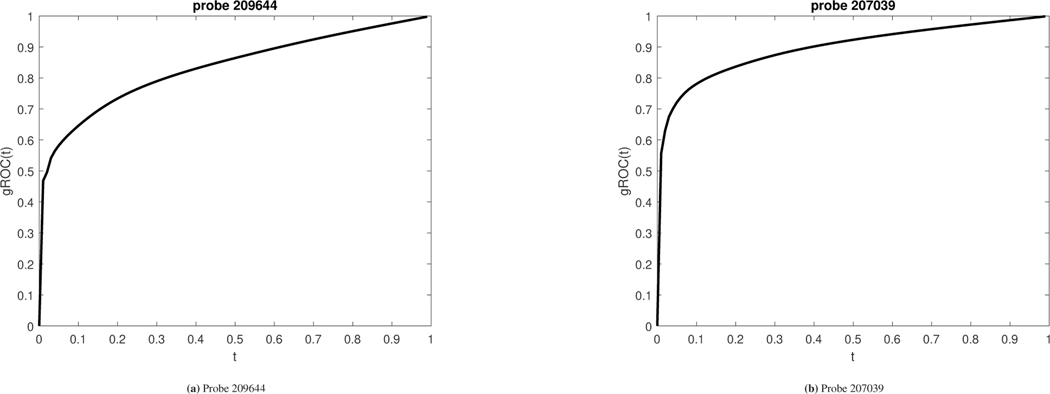
Figure 12.
gROCs for both probes discussed in the application that refers to the esophageal data. Left panel: gROC for probe 209644 with an area under it equal to 0.8238. The two cutoff Youden-based sensitivity and specificity are derived to be (0.8754, 0.6659). The area under the usual empirical ROC estimate is 0.5421 (0.4175–0.6667) which implies that this marker would have been discarded as uninformative in spite of its discriminatory ability. Right panel: gROC for probe 207039 with an area under it equal to 0.8858. The two cutoff Youden-based sensitivity and specificity are derived to be (0.9180, 0.7648). The area under the usual empirical ROC estimate is 0.5185 (0.3963–0.6397) which implies that this marker would have been discarded as uninformative in spite of its discriminatory ability.

