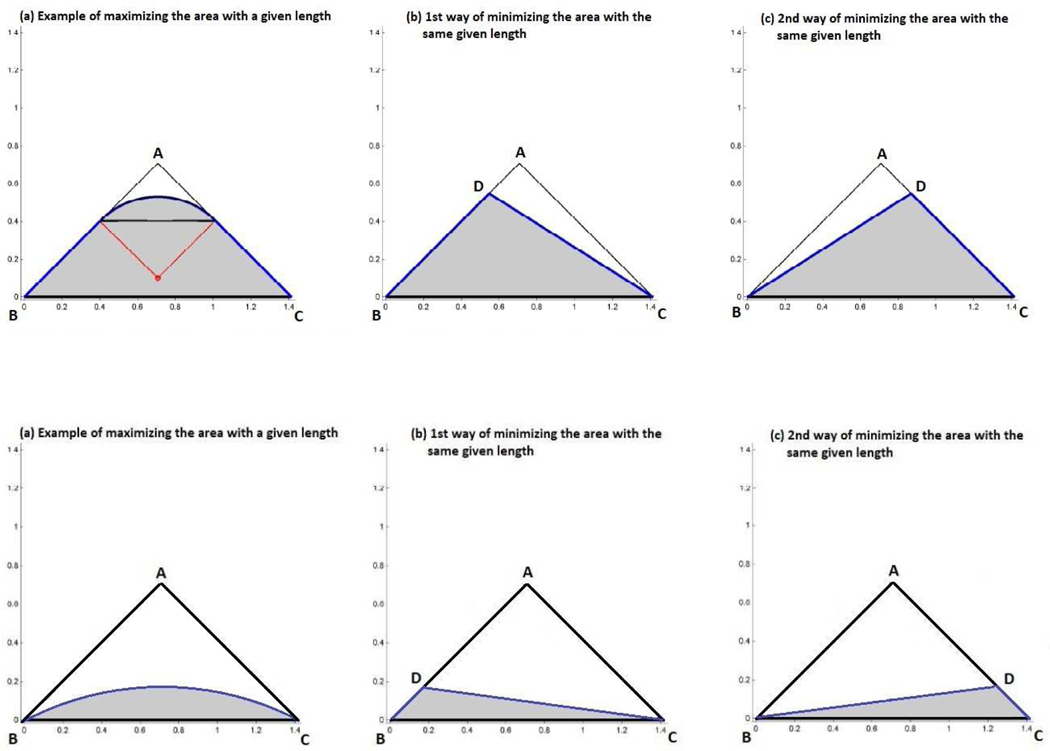
Figure 3. Upper panels:
Geometric representation of the maximum area for a given length when the length is larger than (panel (a)), and the minimum area for the same given length (panels (b) and (c)). Both panels (b) and (c) correspond to the same area. All three panels correspond to the same length. Lower panels: Geometric representation of the maximum area for a given length when the length is smaller than (panel (a)), and the minimum area for the same given length (panels (b) and (c)). Both panels (b) and (c) correspond to the same area. All three panels correspond to the same length.

