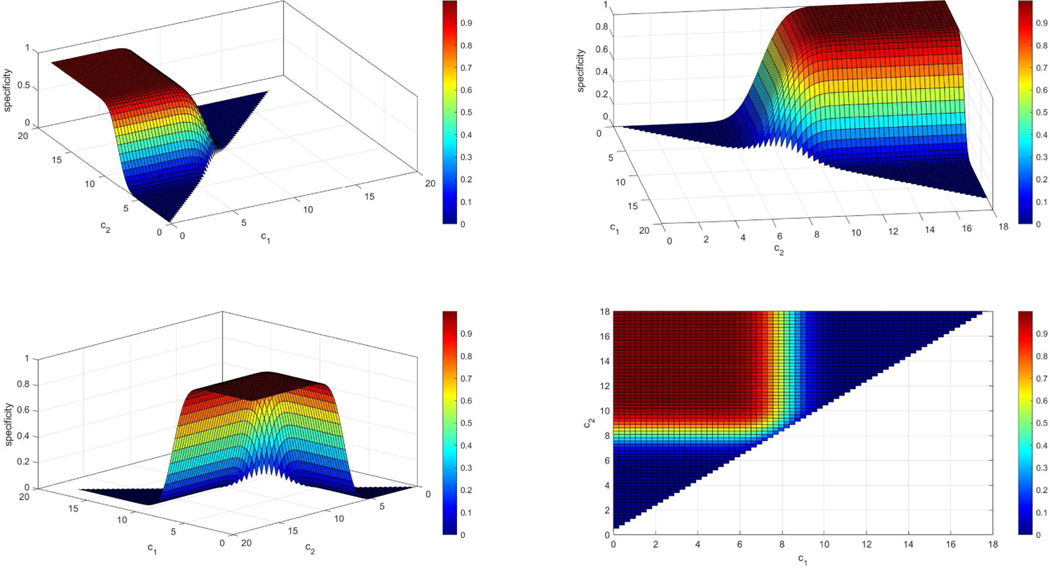
Figure 5.
Example of a specificity surface when the density of the controls is N(8, 1) and the density of the cases is a two component normal mixture: 0.5N(6, 1) + 0.5N(10, 1). The specificity plot is given under four different angles (panels above) for better visualization. We observe that when c1 is very small and c2 is very large then the specificity yields very high values as expected since most healthy individuals will lie within (c1, c2). In addition, if c1 is very close to c2 then we expect that almost all individuals that are healthy will be categorized as diseased and since it is very likely that they will not be between c1 and c2 and thus the specificity for those cutoffs is very low (blue regions).

