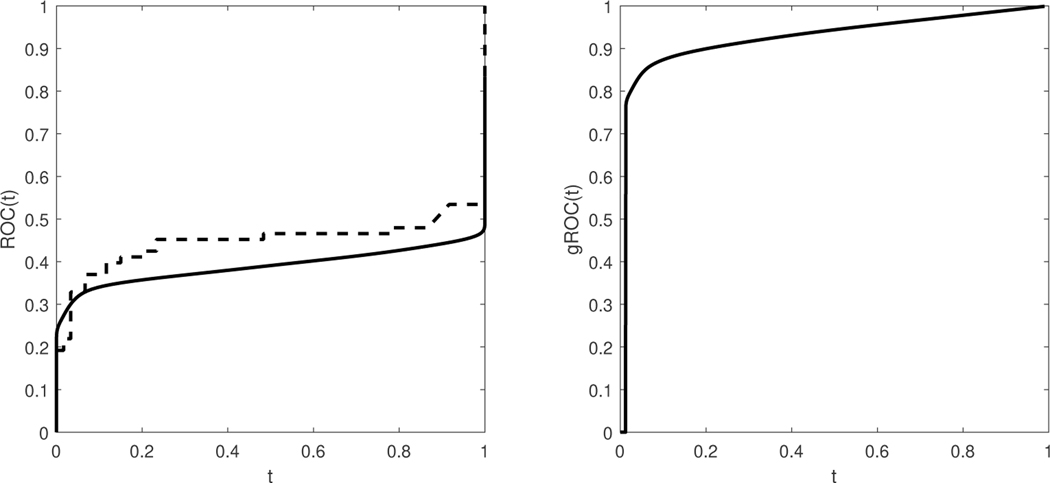
Figure 8.
Left Panel: Traditional ROC curves for the top performing autoantibody: dashed line refers to the empirical, and solid line refers to the kernel-smoothed based one. The corresponding AUCs and 95% CIs are 0.4468(0.3392, 0.5544) and 0.3892(0.3055,0.4730), respectively. The estimated kernel-based length with the corresponding 95% CI is 1.8255 (1.7846–1.8748). Right panel: The corresponding kernel-based estimated gROC. The area under this kernel based estimate of gROC is 0.9154.

