
Figure 2.
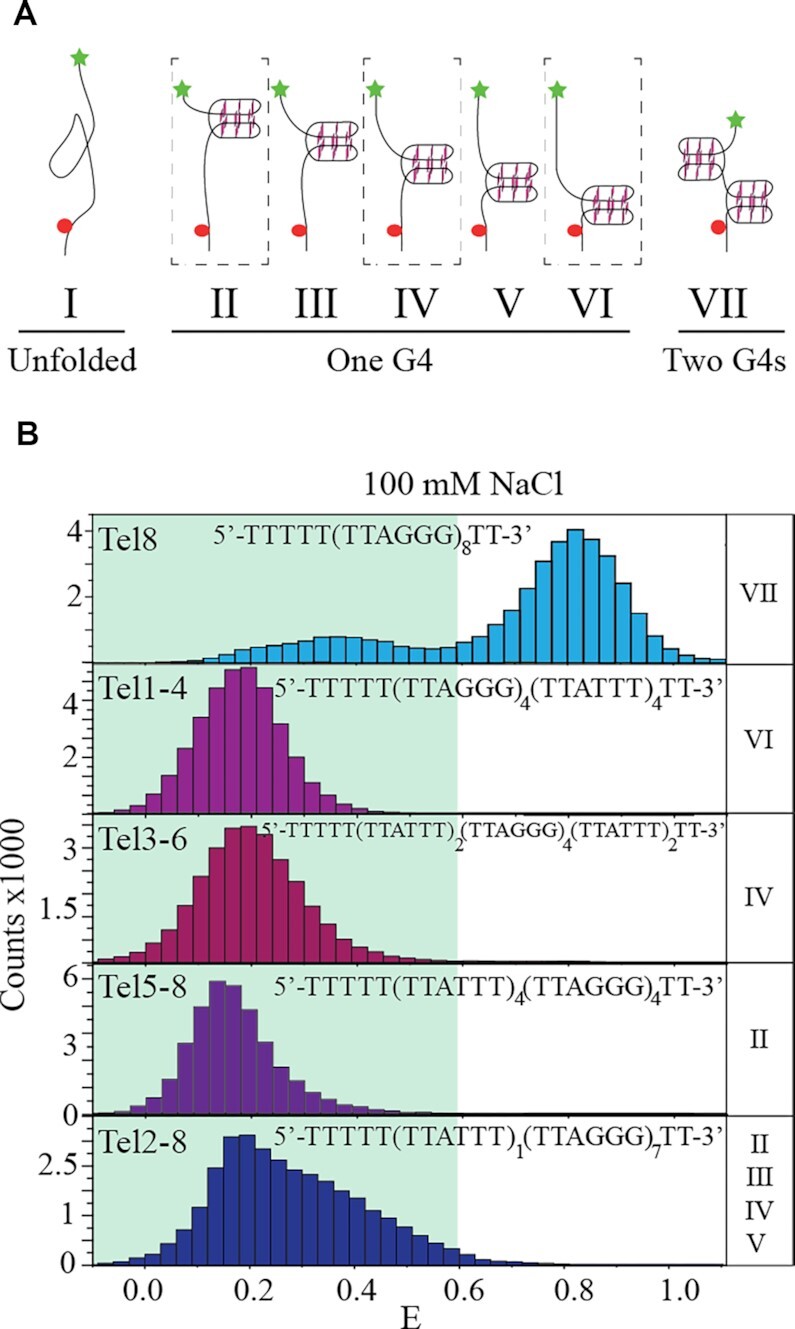
Identification of the population of conformations observed in Tel8 in the presence of 100 mM NaCl. (A) Cartoon drawings of possible G-quadruplex (G4) folding in Tel8 including no G-quadruplexes (unfolded), one G-quadruplex at several positions or two G-quadruplexes. In the drawings, G-quadruplexes are illustrated by three stacking guanine tetrads connected by backbone DNA (black lines). Stars and spheres show Cy5 and Cy3 positions, respectively. (B) FRET histograms of single-molecule data of Tel8 or mutant versions of Tel8. The shaded area in the histograms marks E< 0.6. The name of mutants is noted at the top of their respective histograms. The roman numbers to the right of each histogram refer to the conformations illustrated in panel (A) where G-quadruplexes are expected to form.