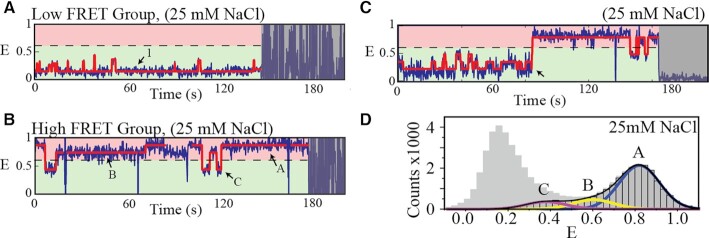
Figure 3.
Analysis of single-molecule FRET time-traces. Results of HMM fitting are shown by red lines. (A, B) Representative FRET time-traces from the two main group classifications, respectively. Dashed line marks E= 0.6. Specific FRET states corresponding to mostly unfolded (1) as well as partially and fully folded DNA conformations (A, B and C) are marked by arrows. (C) Representative FRET time-trace of the small population of the high FRET group that features transitions from the lowest to the highest FRET state (event marked by a black arrow). (D) FRET histogram showing single-molecule data from the low (gray with no edge) and high (gray with black edge) FRET groups.

