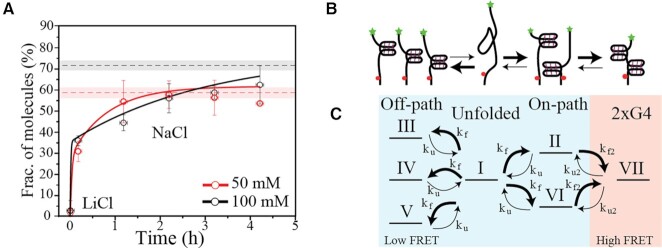
Figure 4.
Time-course investigation of Tel8 condensation. (A) Fraction of fully folded DNA (E≥ 0.6) as a function of time after buffer change from LiCl to NaCl. Data from single-molecule FRET time-course experiments in the presence of 50 and 100 mM NaCl are shown as red and black circles, respectively. Red and black dashed lines mark the proportion of fully folded molecules measured under equilibrium conditions (Supplementary Figure S3); the uncertainty is shown as transparent shading. Red and black lines represent modeled fractions of fully folded G-quadruplexes using experimentally determined reaction rates from single-molecule FRET time-traces taken with 50 and 100 mM NaCl, respectively (see Supplementary Table S6 and Supplementary Figure S13). (B) Simple cartoon of the proposed folding mechanism. Folded structures are shown as G-quadruplexes, but other type of structures may be present in the off-path branch. Initial folding leads to the formation of both fully folded states and off-path structures. Over time the off-path structures collapse and allow refolding to reach the fully folded state of two G-quadruplexes. (C) Detailed model for the proposed folding mechanism, including unfolded, off-path, on-path and two G-quadruplexes (2xG4) conformations, which yielded the full lines in panel (A). Roman numbers refer to the conformations illustrated in Figure 2A. The thickness of the reaction arrows in panels (B) and (C) indicates the expected relative size of the rate constants for either folding or unfolding (kf or ku, respectively) of the one G-quadruplex or folding or unfolding of the second G-quadruplex (kf2 or ku2, respectively).

