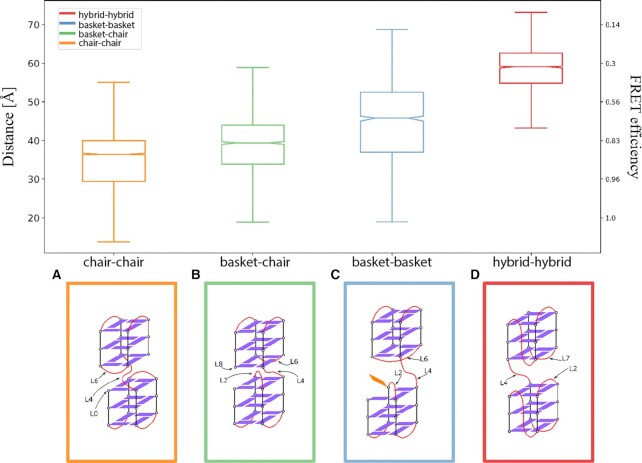
Figure 5.
Summary of results from G-quadruplex in silico CG modeling. Top panel: Box plot of the accessible volume average distances (in Å, left-side y-axis) and the resulting FRET (right-side y-axis) calculated using a Förster radius of 52 Å. The box contains the central interquartile of the sample (central 50% around the median), the bars extend 1.5 times the interquartile range, the line indicates the sample median and the notch is the median 95% confidence interval. Bottom panel: Schematic representations for all CG models: (A) chair–chair system; (B) mixed basket–chair system; (C) basket–basket system; (D) hybrid–hybrid system. Guanine bases are represented as a violet rectangle when forming a G-quartet or as orange rectangle otherwise. Connecting loops are represented as red curved lines. The loops that are observed forming relevant interaction at the interface between the G-quadruplexes are labeled using the naming scheme reported in Figure 1.

