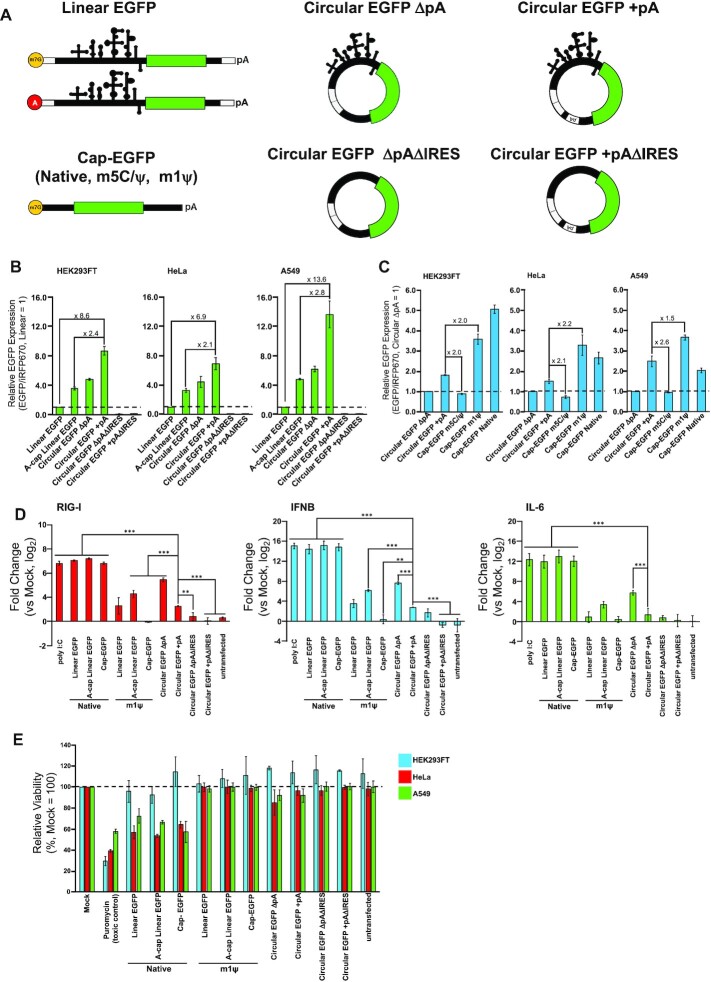
Figure 3.
Comparison of reporter expression and immunogenicity. (A) Structure illustration of linear mRNAs and circRNAs used in these evaluations. All mRNAs code EGFP as a reporter gene. (B) Comparison of reporter expression between circRNAs and linear mRNAs with the same sequence component. 0.3 pmol of each reporter mRNA and transfection control, iRFP670-coding mRNA were transfected. (C) Comparison of circRNAs and linear mRNAs (Cap-EGFPs) without any other structural features corresponding to CVB3 IRES and self-splicing ribozyme. 0.3 pmol of each reporter EGFP-coding mRNA and transfection control, iRFP670-coding mRNA were transfected. (D) Evaluation of immune response-related genes by RT-qPCR after 24 h of transfection in A549 cells. 0.6 pmol of each mRNA was transfected. 200 ng poly I:C was transfected as a positive control. Levels of significance are denoted as **P < 0.01, ***P < 0.001 (Dunnett's test). N.S. (non-significant, P > 0.05) pairs were not denoted on the graph. (E) Evaluation of cytotoxicity by WST-1 assay was performed with a 96-well format. 0.15 pmol of each mRNA was transfected. For toxic control, the cells were cultured in 1 μg/ml (HEK293FT, HeLa) or 2 μg/ml (A549) puromycin for 1 day before the measurement. All data in this figure are presented as mean ± SD, n = 3.

