Figure 4.
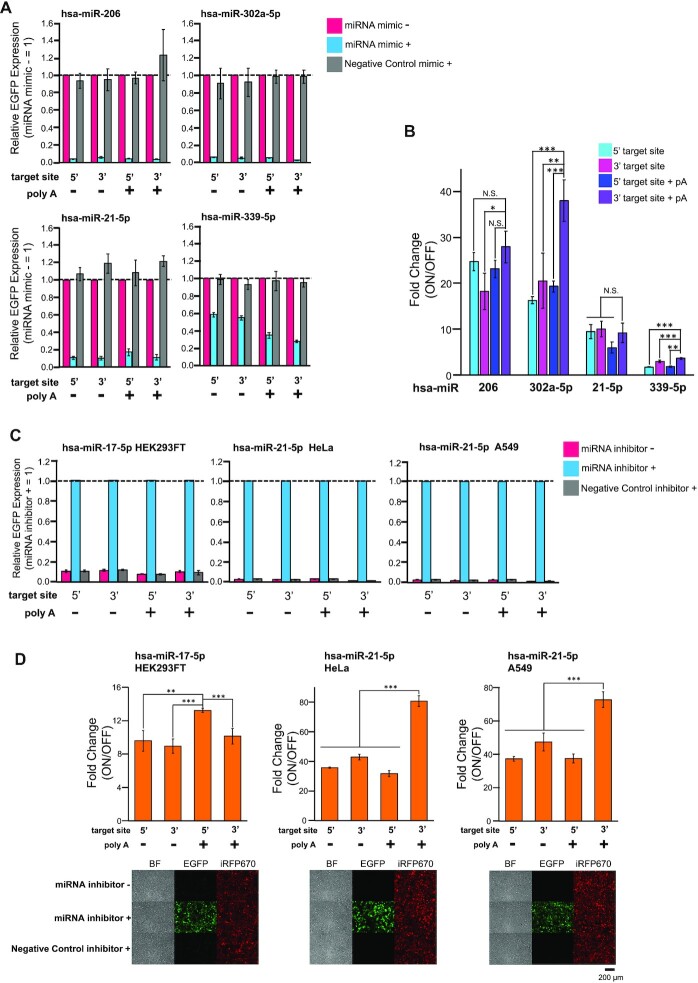
Design and evaluation of miRNA-responsive circRNA switches. (A) Evaluation by co-transfecting miRNA mimics in HEK293FT cells. Relative EGFP Expression was calculated by normalizing the sample without a miRNA mimic (magenta). 0.3 pmol of each reporter mRNA and transfection control mRNA were transfected. 0.25 pmol of specific miRNA mimic or Negative Control mimic was co-transfected for evaluation. (B) The fold-change of each miRNA-responsive circRNAs was evaluated in (A). The ON state was determined as the sample without miRNA mimic. (C) Endogenous miRNA detection by miRNA-responsive circRNAs in HEK293FT, HeLa and A549. Relative EGFP Expression was calculated by normalizing the sample with a specific miRNA inhibitor (cyan). 0.3 pmol of each reporter mRNA and transfection control mRNA were transfected. 1 pmol (hsa-miR-17-5p, HEK293FT), 2 pmol (hsa-miR-21–5p, HeLa) or 4 pmol (hsa-miR-21-5p, A549) of specific miRNA inhibitor or Negative Control inhibitor was co-transfected for evaluation. (D) The fold-change of each endogenous miRNA-responsive circRNA was evaluated in Figure 4C and fluorescent images of miRNA-responsive circRNA switches showing the best fold change. The ON state was determined as the sample with a specific miRNA inhibitor. The scale bar at the fluorescent images indicates 200 μm. Levels of significance are denoted as *P < 0.05, **P < 0.01, ***P < 0.001 (Dunnett's test). N.S. means non-significant (P >0.05). All data in this figure are presented as mean ± SD, n = 3.

