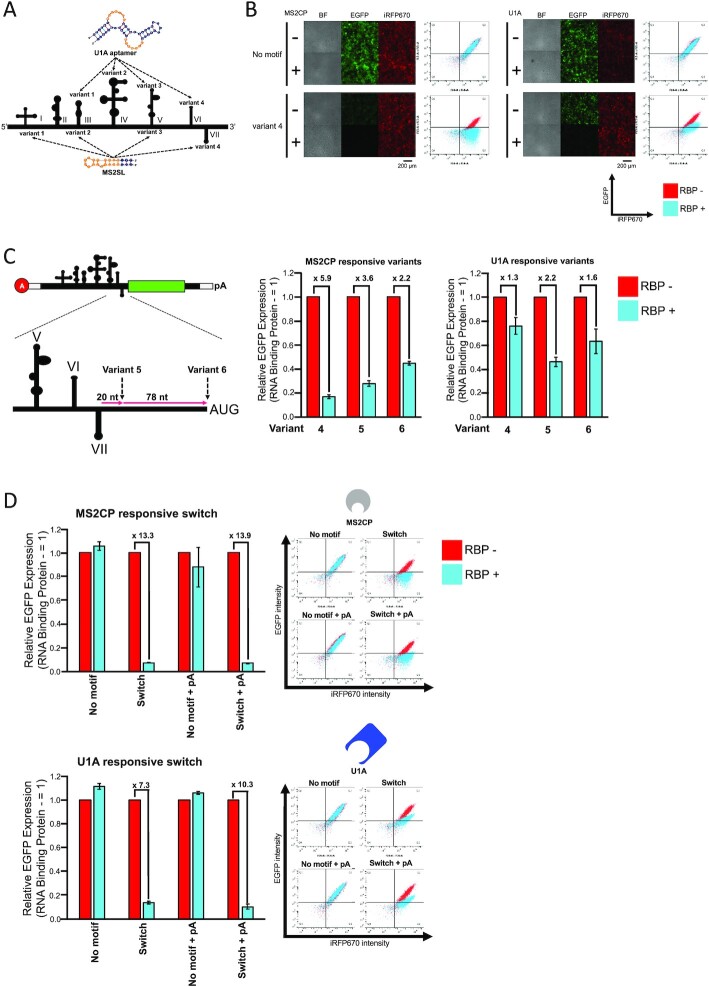
Figure 5.
Design and evaluation of protein-responsive circRNA switches. (A) Investigation of effective position for the protein-binding motif (aptamer) insertion. Four different variants (variants 1–4) were designed by inserting MS2SL or U1A aptamer. Orange bases in MS2SL and U1A aptamer indicate that protein-binding region. (B) Fluorescent microscope images and scatter plots of flow cytometry evaluated by co-transfecting MS2CP or U1A-coding mRNA in HEK293FT. The scale bar at the fluorescent images indicates 200 μm. 0.3 pmol of each reporter mRNA and transfection control mRNA were transfected. 0.05 pmol of RBP (MS2CP or U1A)-coding mRNA was co-transfected for evaluation. (C) Optimization of the position for the motif-insertion. Additional variants were designed by inserting the motif at 20 nt (variant 5) or 98 nt (variant 6) downstream of the domain VII stem-loop. A-cap Linear EGFP with the variants was used for evaluation. 0.3 pmol of each reporter mRNA and transfection control mRNA were transfected. 0.05 pmol of RBP (MS2CP or U1A)-coding mRNA was co-transfected for evaluation. (D) Evaluation of U1A and MS2CP-responsive circRNA switches by using circRNA contexts in HEK293FT cells. 0.3 pmol of each reporter mRNA and transfection control mRNA were transfected. 0.05 pmol of MS2CP-coding mRNA or 0.15 pmol of U1A-coding mRNA was co-transfected for evaluation. All data in this figure are presented as mean ± SD, n = 3. Relative EGFP Expression was calculated by normalizing the sample without target protein-coding mRNA. The plots shown are representative data from three biological replicates. The vertical axis of the scatter plot shows the fluorescence intensity of EGFP, and the horizontal axis shows the fluorescence intensity of iRFP670.

