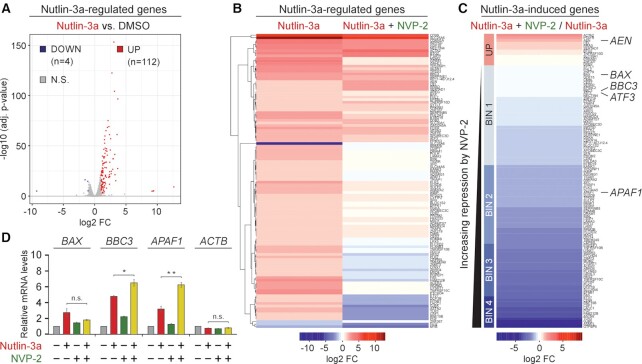
Figure 4.
Sub-lethal inhibition of P-TEFb does not block p53-dependent induction of key pro-death genes of the intrinsic apoptosis pathway. (A) Volcano plot representation of differentially expressed protein-coding genes (n = 116, P-adj ≤ 0.001, log2 FC ≥ 1) from RNA-seq experiments (n = 3) of HCT116 cells treated with DMSO and 10 μM of Nutlin-3a for 8 h. Down-regulated (DOWN), up-regulated (UP) and non-significantly regulated (N.S.) genes are indicated. FC, fold-change. (B) Hierarchically clustered heatmap representation of Nutlin-3a-regulated protein-coding genes (n = 116, P-adj ≤ 0.001, log2 FC ≥ 1) from RNA-seq experiments (n = 3) of HCT116 cells treated with 10 μM of Nutlin-3a alone and in combination with 20 nM of NVP-2 for 8 h. Rows represent log2 FC values of each gene under the depicted treatments on top relative to the values of DMSO-treated cells. FC, fold-change. (C) Heatmap representation of Nutlin-3a-induced protein-coding genes (n= 112, P-adj ≤ 0.001, log2 FC ≥ 1) from RNA-seq experiments (n = 3) in HCT116 cells treated with 10 μM of Nutlin-3a alone and in combination with 20 nM of NVP-2 for 8 h. Rows represent log2 FC values of each gene under the Nutlin-3a + NVP-2 combination treatment relative to the values of Nutlin-3a-treated cells. Genes are sorted from largest to smallest log2 FC values. UP labels genes induced by NVP-2 (log2 FC > 0). BIN 1 (0 > log2 FC ≥ −1), BIN 2 (−1 > log2 FC ≥ −2), BIN 3 (−2 > log2 FC ≥ −3) and BIN 4 (log2 FC < −3) labels genes repressed by NVP-2. FC, fold-change. (D) HCT116 cells were treated with DMSO, Nutlin-3a (10 μM) and NVP-2 (10 nM) alone and in combination as indicated for 24 h prior to quantifying mRNA levels of the indicated genes with RT-qPCR. Results normalized to the levels of GAPDH mRNA and DMSO-treated cells are presented as the mean ± s.e.m. (n = 3); *, P < 0.05; **, P < 0.01; n.s., non-significant, determined by Student’s t test.

