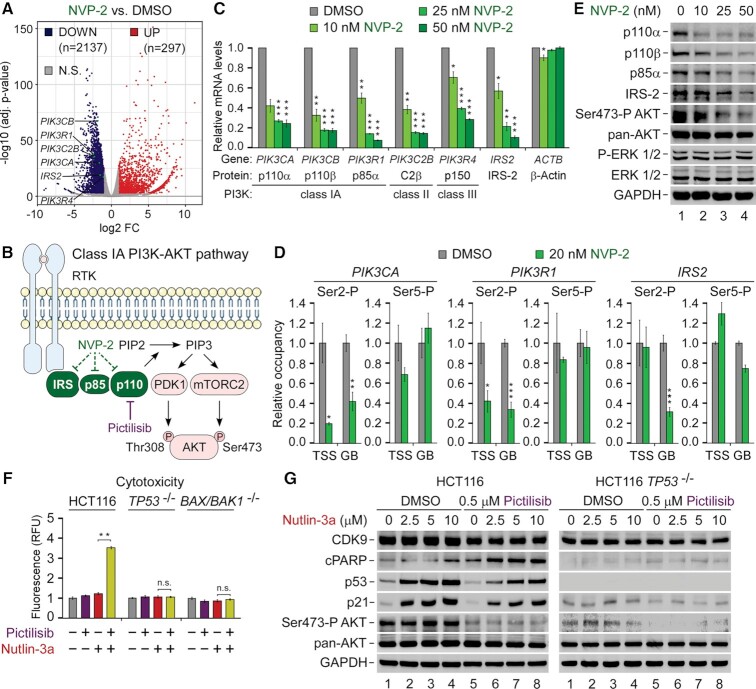
Figure 6.
Repression of P-TEFb-dependent genes encoding key components of the pro-survival PI3K-AKT pathway is a driver of the synthetic lethality of p53 activation and P-TEFb inhibition. (A) Volcano plot representation of differentially expressed protein-coding genes (P-adj ≤ 0.001; log2 FC ≥ 1) from RNA-seq experiments (n = 3) of HCT116 cells treated with DMSO and 20 nM of NVP-2 for 8 h. Down-regulated (DOWN), up-regulated (UP) and non-significantly regulated (N.S.) genes are indicated. FC, fold-change. (B) Cartoon depicting Class IA PI3K-AKT pathway. Ligand-induced activation of transmembrane receptor tyrosine kinase (RTK) results in autophosphorylation on tyrosine residues, recruiting the PI3K catalytic subunit p110α/β/δ to the membrane via PI3K regulatory subunits, such as p85α, of which SH2 domains bind phosphotyrosyl residues on RTKs or adaptor proteins, e.g. IRS-2. Allosterically activated, PI3K phosphorylates phosphatidylinositol 4,5-bisphosphate (PIP2) to produce phosphatidylinositol 3,4,5-trisphosphate (PIP3). PIP3 acts as a second messenger to recruit the serine/threonine protein kinase AKT to the plasma membrane alongside phosphoinositide-dependent kinase-1 (PDK-1) and mechanistic target of rapamycin complex 2 (mTORC2), which activate AKT fully by phosphorylating Thr308 and Ser473, respectively. Dashed lines denote transcriptional repression of genes encoding IRS-2, p85α and p110 by NVP-2. Pharmacological targeting of p110α/β/δ by the pan-inhibitor of class I PI3K Pictilisib is indicated. (C) HCT116 cells were treated with DMSO and increasing doses of NVP-2 for 8 h prior to quantifying mRNA levels of the indicated genes with RT-qPCR. Proteins encoded by the genes and their PI3K protein family classes are indicated. Results normalized to the levels of GAPDH mRNA and DMSO-treated cells are presented as the mean ± s.e.m. (n = 3); *, P < 0.05, **, P < 0.01, ***, P < 0.001, determined by Student’s t test. (D) HCT116 cells were treated with DMSO and NVP-2 (20 nM) for 3 h prior to determining the levels of Ser2-P and Ser5-P forms relative to total Pol II at transcription start site (TSS) and gene body (GB) of the indicated genes with ChIP-qPCR. Results normalized to the values of DMSO-treated cells that were set to 1 are presented as the mean ± s.e.m. (n = 2); *, P < 0.05, **, P < 0.01, ***, P < 0.001, determined by Student’s t test. (E) HCT116 cells were treated with DMSO and increasing doses of NVP-2 for 24 h prior to preparation of whole cell extracts and detection of the indicated proteins by western blotting. (F) Cytotoxicity of HCT116, HCT116 TP53 −/− and HCT116 BAX/BAK1 −/− cells treated with DMSO, Pictilisib (1 μM), and Nutlin-3a (10 μM) alone and in combination as indicated for 48 h measured using CellTox Green Cytotoxicity Assay. Results are presented as fluorescence values relative to the values of DMSO-treated cells and plotted as the mean ± s.e.m. (n = 3); **, P < 0.01, n.s., non-significant, determined by Student’s t test. (G) HCT116 and HCT116 TP53 −/− cells were treated with DMSO and indicated combinations and doses of Pictilisib and Nutlin-3a for 24 h prior to preparation of whole cell extracts and detection of the indicated proteins by western blotting.

