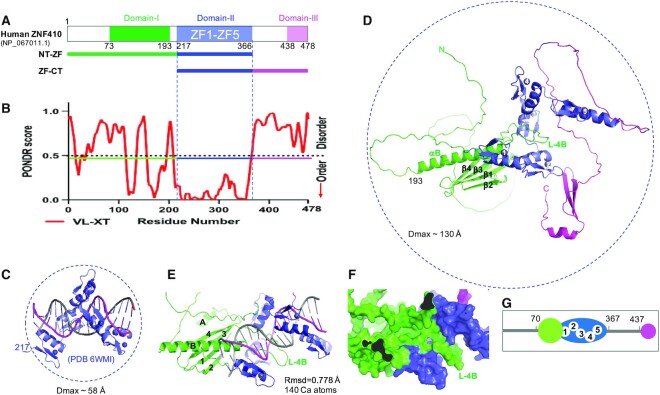
Figure 1.
Structure prediction of full length human ZNF410. (A) Schematic of ZNF410 comprising three regions: N-terminal (NT; green), a tandem of five zinc fingers (ZF; blue) and C-terminal (CT; magenta). (B) PONDR prediction shows two ordered regions of residues 100–200 and the central ZF domain. (C) The crystal structure of five ZFs (residues 217–366) in complex with DNA (PDB 6WMI). (D) AlphaFold prediction of ZNF410 structure in the absence of DNA. NT, ZF and CT are represented in green, blue and magenta respectively. The secondary structural elements of the NT domain are labeled (helices αA and αB and strands β1–β4). (E) Superposition of AlphaFold model and experimentally determined structure of the ZF-DNA complex (PDB 6WMI). (F) Surface representation of the 30-residue-long helix (αB) and its preceding loop (L4B), occupying the DNA binding surface of the ZF domain. (G) Cartoon representation of ordered regions in ZNF410, represented as in (A, D, E and F) in green, blue and magenta. Five ordered ZFs are numbered. The green colored N-terminal domain occupied the DNA binding surface in the absence of DNA.

