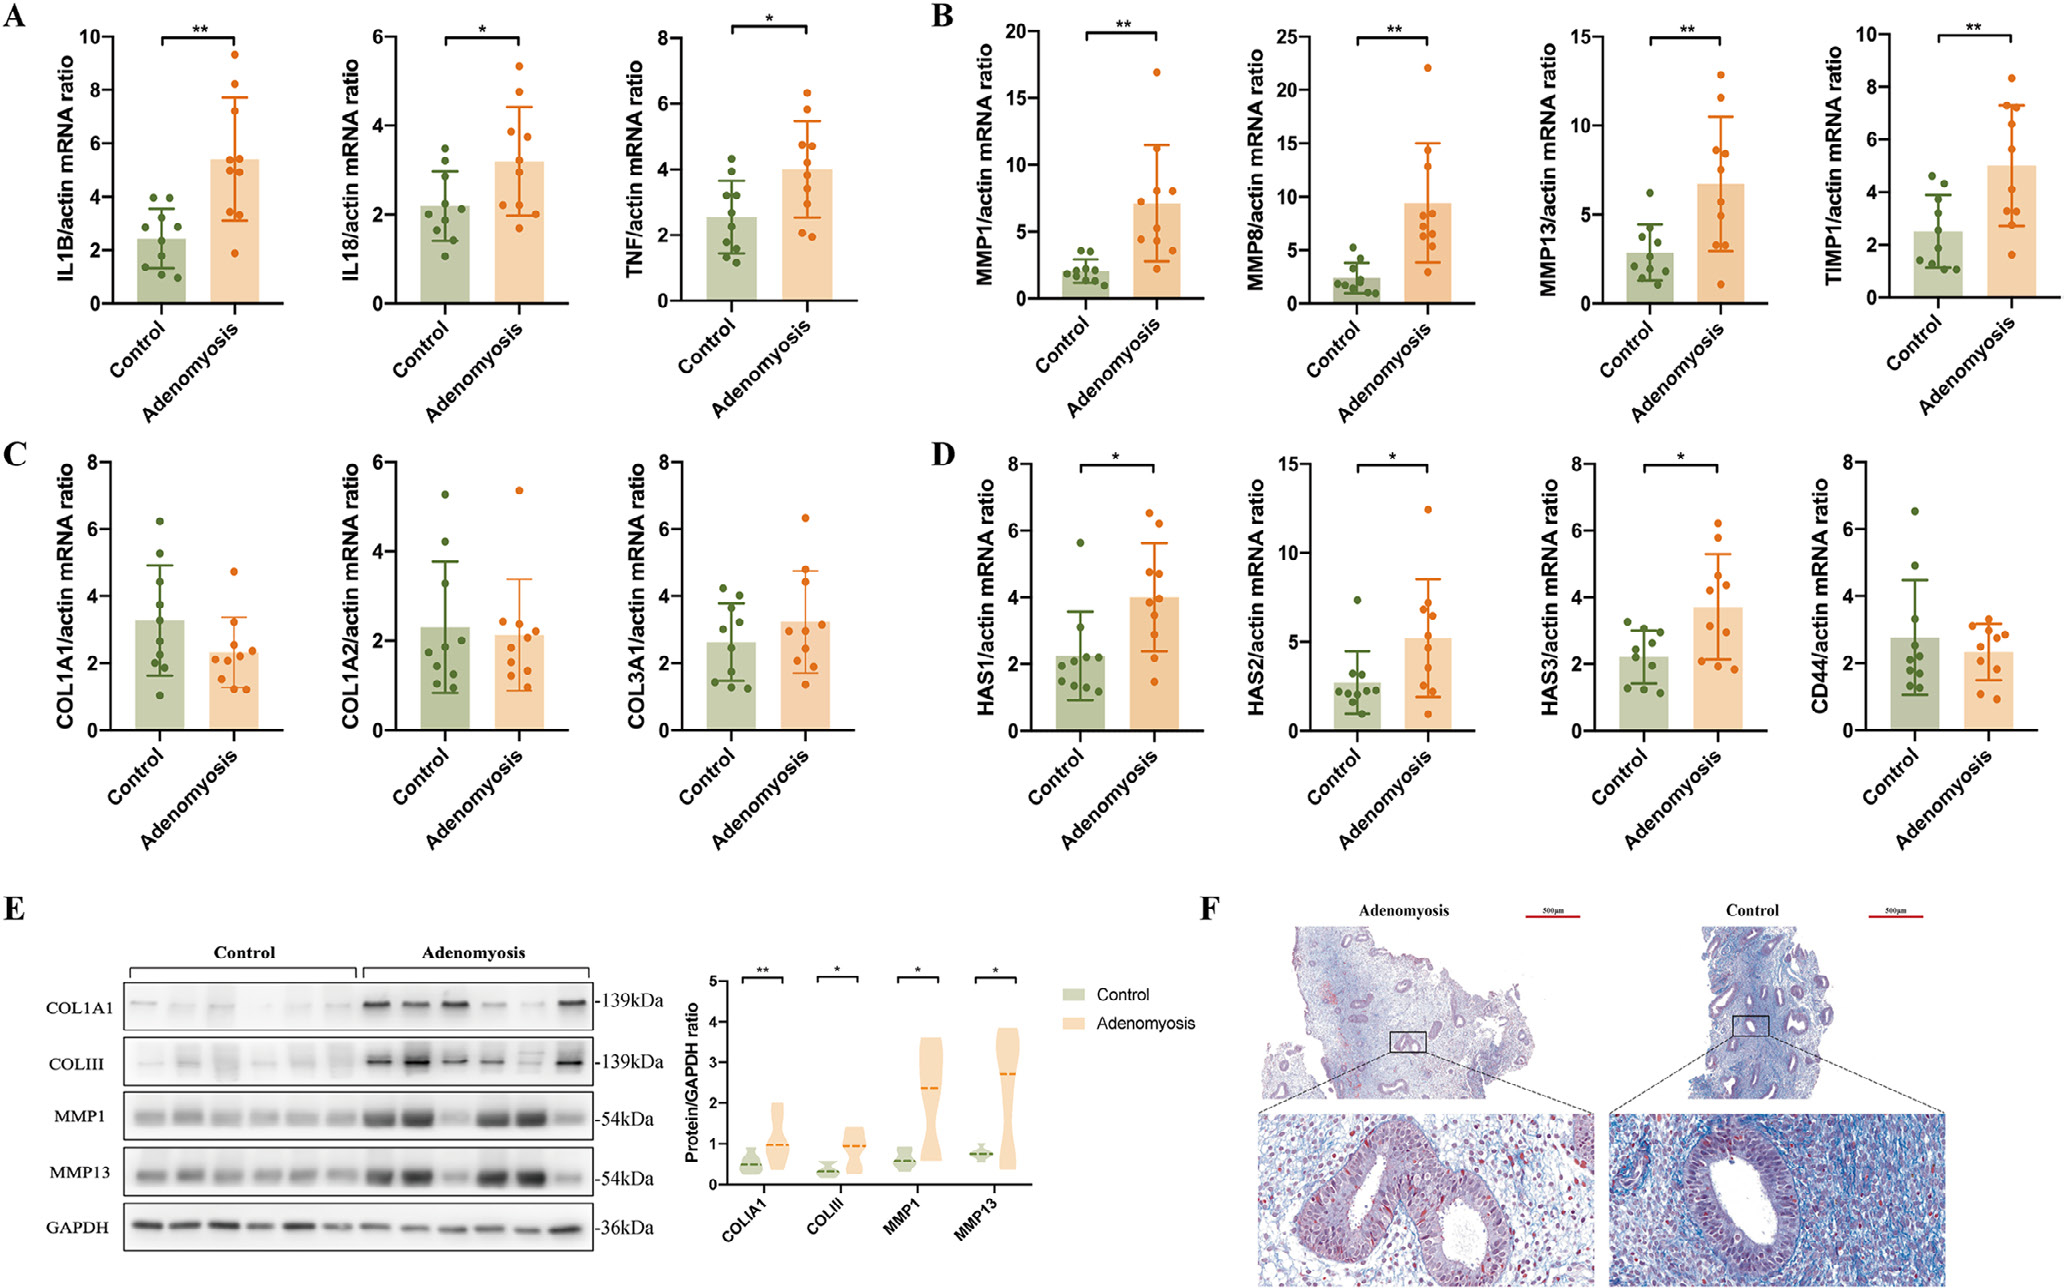
FIGURE 3.

Validation of potential target genes in top enriched biological processes in the eutopic endometrium of women with versus without adenomyosis. (A) mRNA levels of IL1B, IL18 and TNF in eutopic endometrium of adenomyosis patients (n = 10) and controls (n = 10) detected by quantitative reverse transcription polymerase chain reaction analysis (qRT-PCR). All endometrial samples were in the proliferative phase. β-ACTIN was used as reference gene for qRT-PCR analysis. P-values are 0.002, 0.041 and 0.022, respectively; (B) mRNA levels of MMP1, MMP8, MMP13 and TIMP1 in eutopic endometrium of adenomyosis patients (n = 10) and controls (n = 10) detected by qRT-PCR analysis. P-values are 0.002, 0.001, 0.008 and 0.0085, respectively; (C) mRNA levels of COL1A1, COL1A2 and COL3A1 in eutopic endometrium of adenomyosis patients (n = 10) and controls (n = 10) detected by qRT-PCR analysis; (D) mRNA levels of HAS1, HAS2, HAS3 and CD44 in eutopic endometrium of adenomyosis patients (n = 10) and controls (n = 10) detected by qRT-PCR analysis. P-values are 0.016, 0.049, 0.015 and 0.484, respectively. Data are presented as means ± SEM. *P < 0.05, **P < 0.01; (E) protein levels of COL1A1, COLIII, MMP1 and MMP13 in the endometrium of adenomyosis patients and controls. n = 6 for each group. GAPDH was used as reference control, and the ratio of band intensity of a target protein to that of the intensity of GAPDH was obtained at each target protein level (Li et al., 2018). The P-value of the protein level of COL1A1, COLIII, MMP1 and MMP13 in adenomyosis versus controls are 0.009, 0.024, 0.018 and 0.031, respectively. *P < 0.05, **P < 0.01; (F) Masson stain of eutopic endometrium in adenomyosis patients versus controls.
