Figure 3.
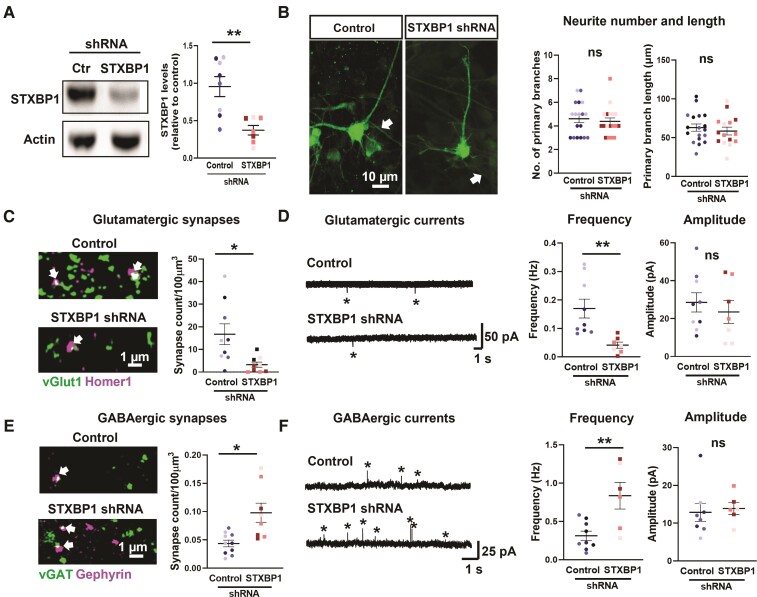
Divergent regulation of glutamatergic and GABAergic synapses in the subplate following knock-down of STXBP1. (A) Left shows a western blot showing knock-down of STXBP1 protein in a whole slice at 16 pcw following 14 DIV with scrambled control (Ctr) or STXBP1 shRNA. Right shows a quantification of band intensity showing a ∼50% reduction in STXBP1 levels (unpaired t-test, taken from n = 8 slices/condition from three human samples). (B) Left shows the example subplate neurons infected with scrambled control or STXBP1 shRNA for 14 DIV at 16 pcw. Note the putative axons highlighted with the arrows. Right shows the quantification of primary neurite number and length reveals no gross morphology changes in both conditions (n = 30 cells from 15–18 slices and three human samples). (C and E) Quantification of glutamatergic synapses (arrows) (C) and GABAergic (E) synapses (arrows) in the subplate at 16 pcw following 2 weeks of scrambled control or STXBP1 shRNA by colocalization of pre- and post-synaptic markers. Analysis performed using an unpaired t-test, n = 8–10 slices per condition from three human samples. (D and F) Representative miniature glutamatergic post-synaptic currents recorded at −60 mV (D) and miniature GABAergic post-synaptic currents recorded at 0 mV (F) from 16 pcw subplate cells in both genetic conditions. The frequency and amplitude of events (starred) were quantified (unpaired t-test, n = 12 cells and 7–9 slices per condition from three human samples). Data presented as scatter plots and mean ± SEM displaying all slice data-points with each human sample per condition represented by a different colour shade.

