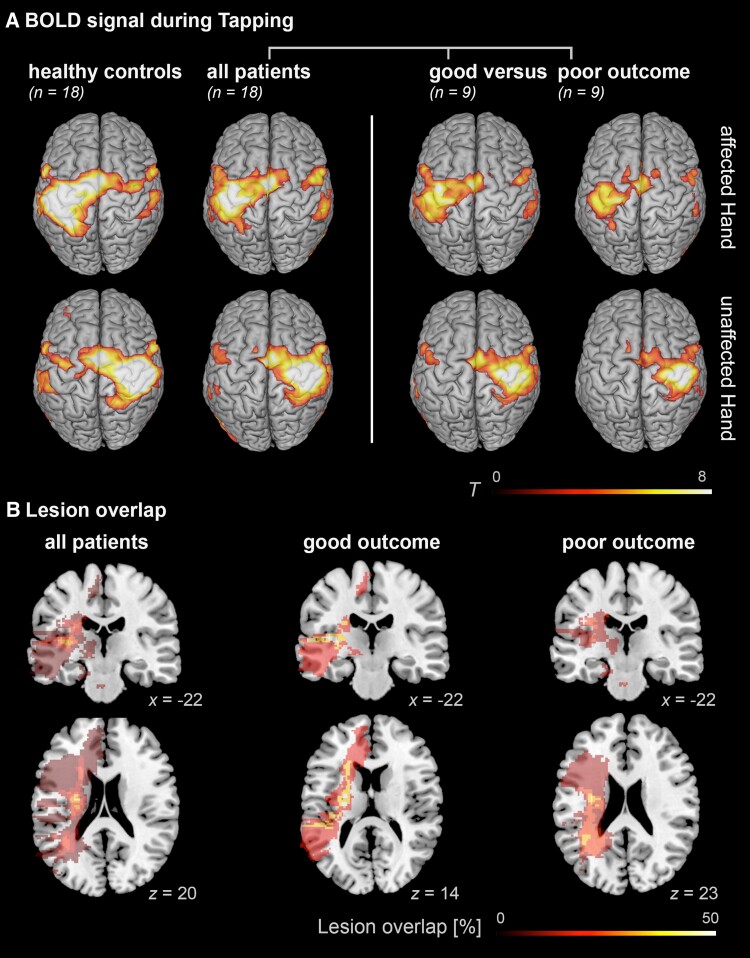
Figure 3.
Activation and lesion maps. (A) Group effects of BOLD activation indicating reduced activation in the ipsilesional M1 in impaired patients when tapping with the affected hand, whereas patients with good outcome show more activation of contralesional frontoparietal regions. Results were FWE cluster-level corrected at a threshold of P < 0.05 (cluster-forming threshold at the voxel level: P < 0.001). (B) Lesion overlap of stroke patients, based on T2 images. Lesion maps showed maximal overlap in the internal capsule in all patients as well as the two patient subgroups.

