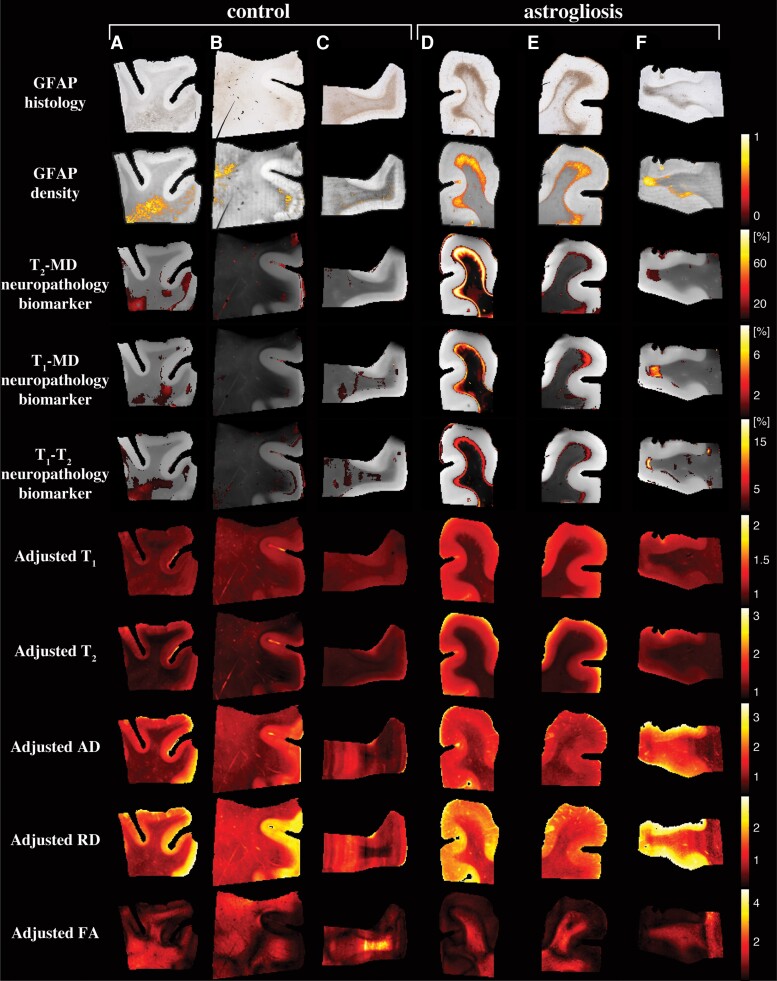
Figure 5.
Multidimensional and voxel-averaged MRI maps. A–C are subjects without severe astrogliosis (Cases 3, 4 and 7), while D–F had substantial GFAP overexpression (Cases 10–12). The different rows correspond to the different MRI contrasts, including all the conventional relaxation and DTI parameters, and the proposed multidimensional astrogliosis maps. In addition, the co-registered histological GFAP images and density maps are shown. Multidimensional neuropathology maps overlaid onto proton density images show substantial injury along the grey–white matter interface, while conventional MRI maps of T1, T2, AD, RD and FA do not show visible abnormalities. Note that to facilitate visualization, the multidimensional neuropathology MRI biomarker maps were thresholded at 10% of the maximal intensity and overlaid on greyscale proton density images.

