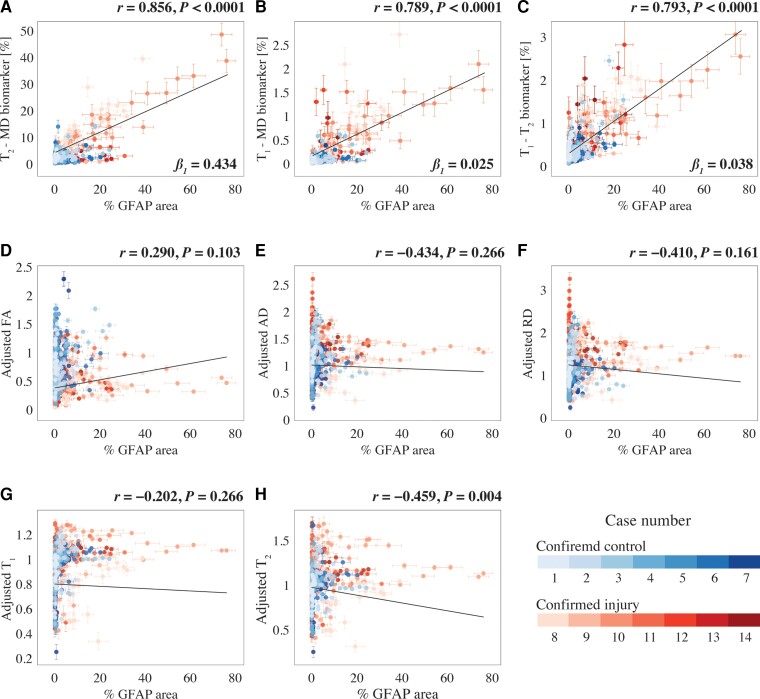
Figure 6.
Radiological-pathological correlations between MRI metrics and GFAP density. GFAP density (% area) from 556 tissue regions from 14 subjects (colour-coded, see legend) and the corresponding MR parameter correlations. Individual data points represent the mean value from each post-mortem tissue sample. Scatterplots of the mean (with 95% CI error bars) % area GFAP and (A) T2-MD, (B) T1-MD and (C) T1–T2 injury MRI biomarkers show strong positive and significant correlation with GFAP density. The conventional MRI metrics in D–G did not result in strong and significant correlations with % area GFAP, apart from weak yet significant correlation of (H) voxel-averaged T2.

