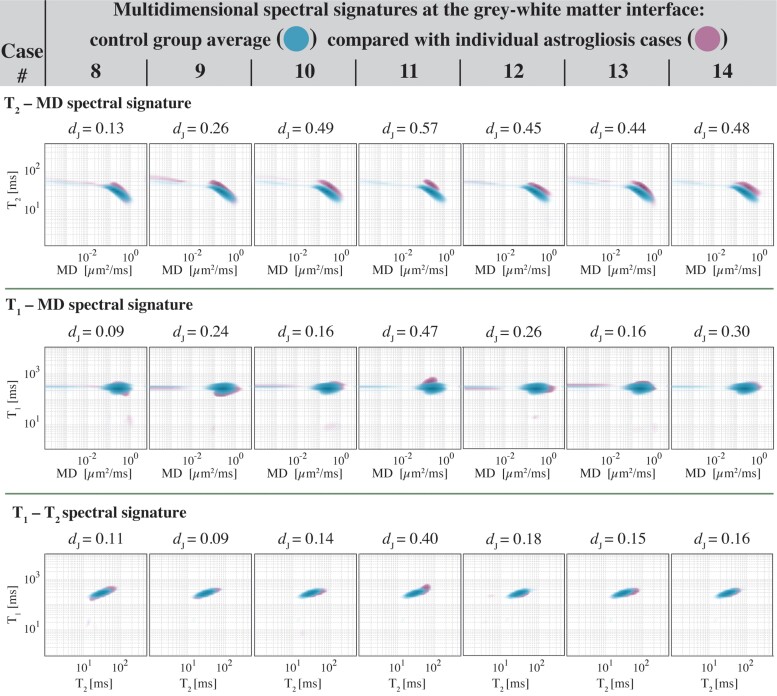
Figure 7.
Comparisons of normal-appearing grey–white matter interface and interface astrogliosis multidimensional signatures. Spectral signatures from all control cases were averaged, yielding a grey–white matter interface spectral signature control group average for each MR dataset (blue). Interface astrogliosis spectral signatures from each GFAP-positive case (purple) are individually compared with the control group average and the Jensen Distance between control group average and individual signatures are shown for each case. As a reference, the Jensen Distances between normal-appearing WM and GM across the entire study was 0.53, 0.13 and 0.21 for the T2-MD, T1-MD and T1–T2 spectral signatures, respectively.

