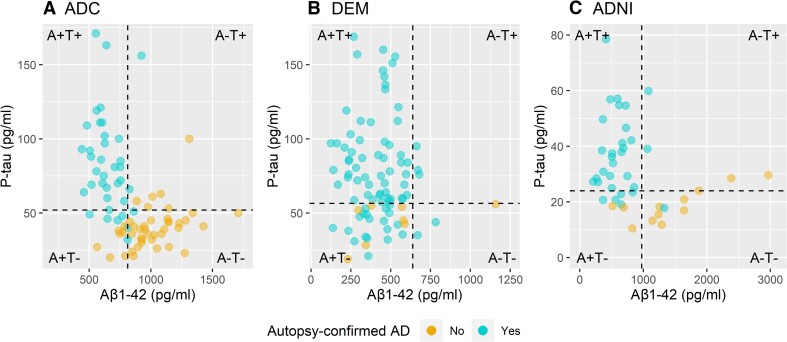
Figure 1.
Neuropathological confirmation of AD and biomarker AT classification. (A) ADC, (B) DEM and (C) ADNI. The dotted vertical lines correspond to the Aβ1-42 cutoffs of <813 pg/ml for ADC, <638.5 pg/ml for DEM and <977 pg/ml for ADNI. The dotted horizontal lines correspond to the p-tau cutoffs of >52 pg/ml for ADC, >56.5 pg/ml for DEM and >24 pg/ml for ADNI.

