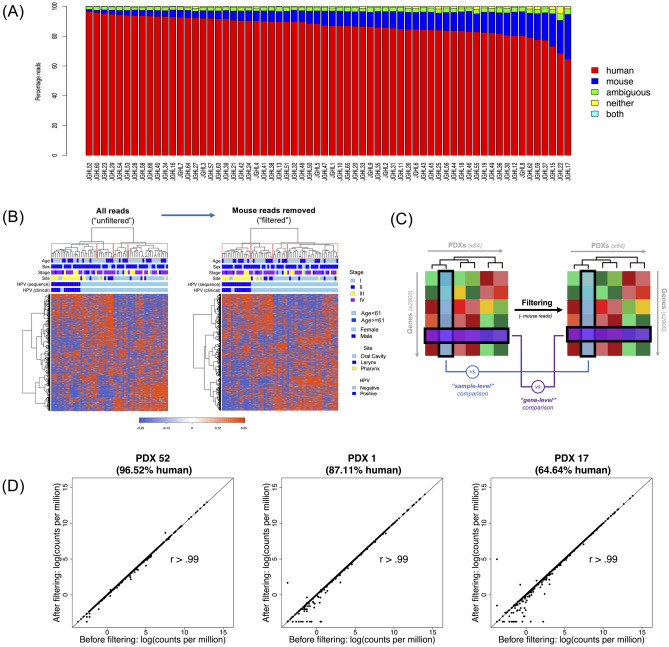
Fig 1. Mapping and filtering species-specific reads in the PDX transcriptome.
(A) Bar Chart depicting the percentage of mRNA reads [y-axis] uniquely mapped to human (red) and mouse (blue) genomes, or ambiguous (green), neither (yellow), or both genomes (cyan) for each of the 64 PDX models in this study [x-axis]. (B) Hierarchical clustering based on the top 2,000 most variable genes between PDXs, using an “unfiltered” set with all reads (left) and “filtered” set with mouse reads removed (right). (C) Schematic of the distinction between “sample-level” (comparing clustergram columns [blue]) and “gene-level” (comparing clustergram rows [purple]) correlation comparisons. (D) Representative sample-level correlation plots from PDXs with the highest, intermediate, and lowest percentage of human reads (PDX 52, 96.52% human; PDX 1, 87.11% human; PDX 17, 64.64% human).

