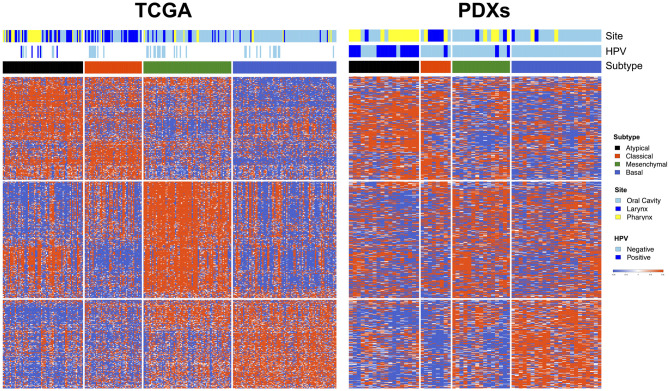
Fig 2. PDXs recapitulate molecular HNSCC subtypes identified in TCGA.
Comparison of gene expression patterns between HNSCC samples in TCGA (left, vertical columns) and the HNSCC PDXs of this cohort (right, vertical columns), with rows representing TCGA classifier genes. The four well-characterized HNSCC molecular TCGA subtypes are conserved in the PDX collection (black, atypical; red, classical; green, mesenchymal; blue, basal).

