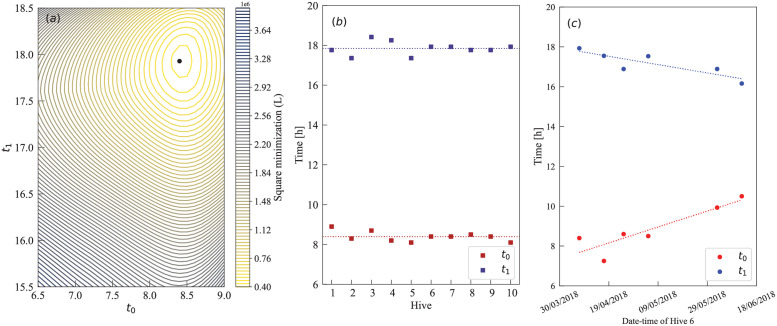
Fig 5. Inference of activity times t0 and t1.
(a) Contour plot of L obtained performing multiple minimizations at fixed t0 and t1 (‘Hive 6’ at 2018–4-7). The minimum L is at t0 = 8.40 h and t1 = 17.93 h. (b) Estimated t0 and t1 fluctuate around similar values for ten different hives located in close proximity when analysing data sets during the same day. E.g. at 2018–4-7, the different activity times oscillate around t0 = 8.4 h and t1 = 17.85 h, respectively (dashed lines). (c) Time evolution for the optimum t0 and t1 for ‘Hive 6’ only. Transitioning from Autumn to Winter, we observe a linear increase for t0 and a linear decrease for t1 (linear regression).

