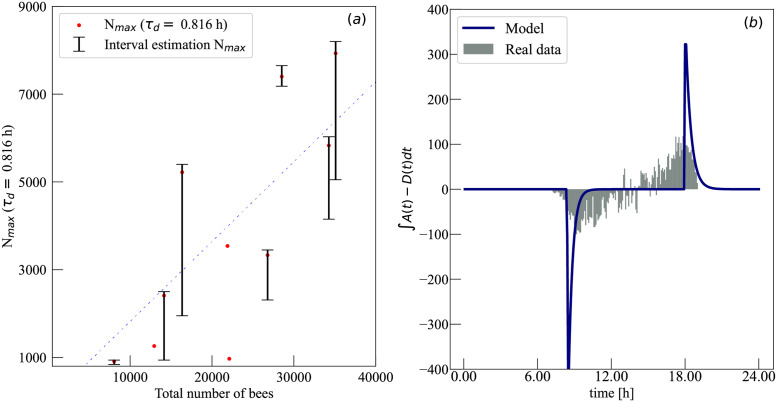
Fig 6. Comparing our model to independent measurements.
(a) Our estimation of the number of active foragers Nmax correlates positively with the total number of bees (R2 = 0.596, p = 0.036). The dashed straight line corresponds to 18.2% of all bees being foragers, constant across all hives. The total number of bees was estimated through an independent measurement performed on 2018–04-9, two days after the data used in our inference [34]. The points without bars correspond to those that had no successful interval estimation, as discussed in Table 2. In all our analysis of correlation between variables, the reported p-value p is the probability of obtaining a positive coefficient of determination R2 equal or larger than the reported R2 under the null hypothesis that the variables are independent from each other. (b) The plot represents the difference between the number of bees arriving and bees departing a honey-bee hive during a 5 minutes interval. The model prediction (blue line) was computed integrating A(t) − D(t) over each time interval. The real data was measured using bee-tracking methods.

