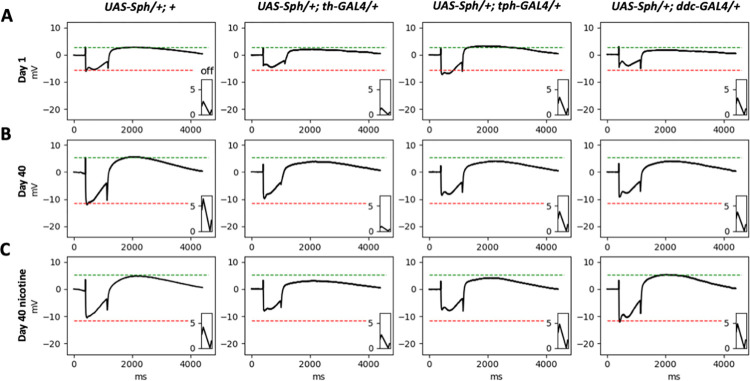
Fig 4. Representative electroretinograms of flies expressing Sph-1 in dopaminergic, serotonergic or in the two aminergic neuronal populations.
The electroretinograms were obtained from flies at 1 and 40 days post-eclosion, and represent both nicotine-treated and non-treated animals. The green lines in the figure depict the average magnitude of the "on" transient, while the red lines show the average magnitude of the PRP of the corresponding control line. It is clear from the figure how different genotypes, ages, and treatments can affect the magnitude of these parameters. The parameters that were quantified in this study include the "on" transient (green lines), the "off" transient (inlay), and the PRP (red line). The quantification of these parameters in multiple flies is presented in Fig 5.

