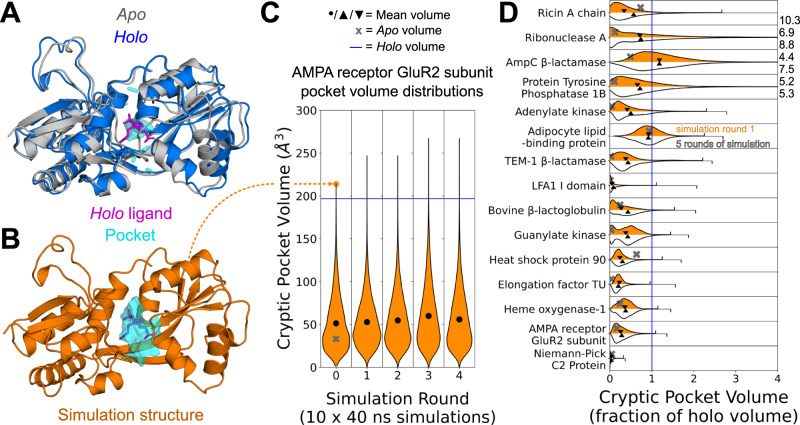
Fig. 2. Cryptic pockets rapidly open in simulations started from closed apo structures.
A Structural overlay of the GluR2 subunit of the AMPA receptor protein in its apo (grey, PDB: 1MY072) and holo (blue, PDB: 1N0T73) conformations reveals that a loop and helix must shift to form a cryptic pocket. B A structure from an MD simulation started from the closed apo conformation with a pocket at the binding site with a volume exceeding that of the holo binding site pocket (orange). C MSM-weighted violin plots of cryptic pocket volume in simulations of the GluR2 subunit of the AMPA receptor show that the ligand binding site exceeds the volume seen in the holo conformation within only 10 parallel simulations of 40 ns each. Cryptic pocket volume was calculated by assigning each LIGSITE30 grid point to the single nearest residue and summing up the volumes assigned to all cryptic pocket residues (see Methods). The grey ‘X’ indicates the apo binding site cryptic pocket volume, the blue line indicates the holo volume, and the black dot indicates the MSM-weighted mean volume of all frames for each round of simulation. D MSM-weighed distributions of cryptic pocket volumes from simulation of 15 different proteins show that even 10 short simulations are usually sufficient to reach the cryptic pocket volume of the holo structure. The pocket volume distribution as a fraction of the holo volume for 10 short simulations (400 ns of cumulative simulation) is shown in orange while the distribution for five rounds of adaptive sampling (2 microseconds of sampling) is shown in white. The grey ‘X’ indicates the apo cryptic pocket volume as a fraction of holo, and the downward-pointing and upward-pointing triangles represent the MSM-weighted mean volume after 10 simulations (1 round) or 5 rounds of adaptive sampling respectively. The maximum cryptic pocket volumes as a fraction of holo reached in simulation are shown with tick marks or given numerically to the right of the plot if they lie outside the plot’s range. Source data are provided as a Source Data file.

